
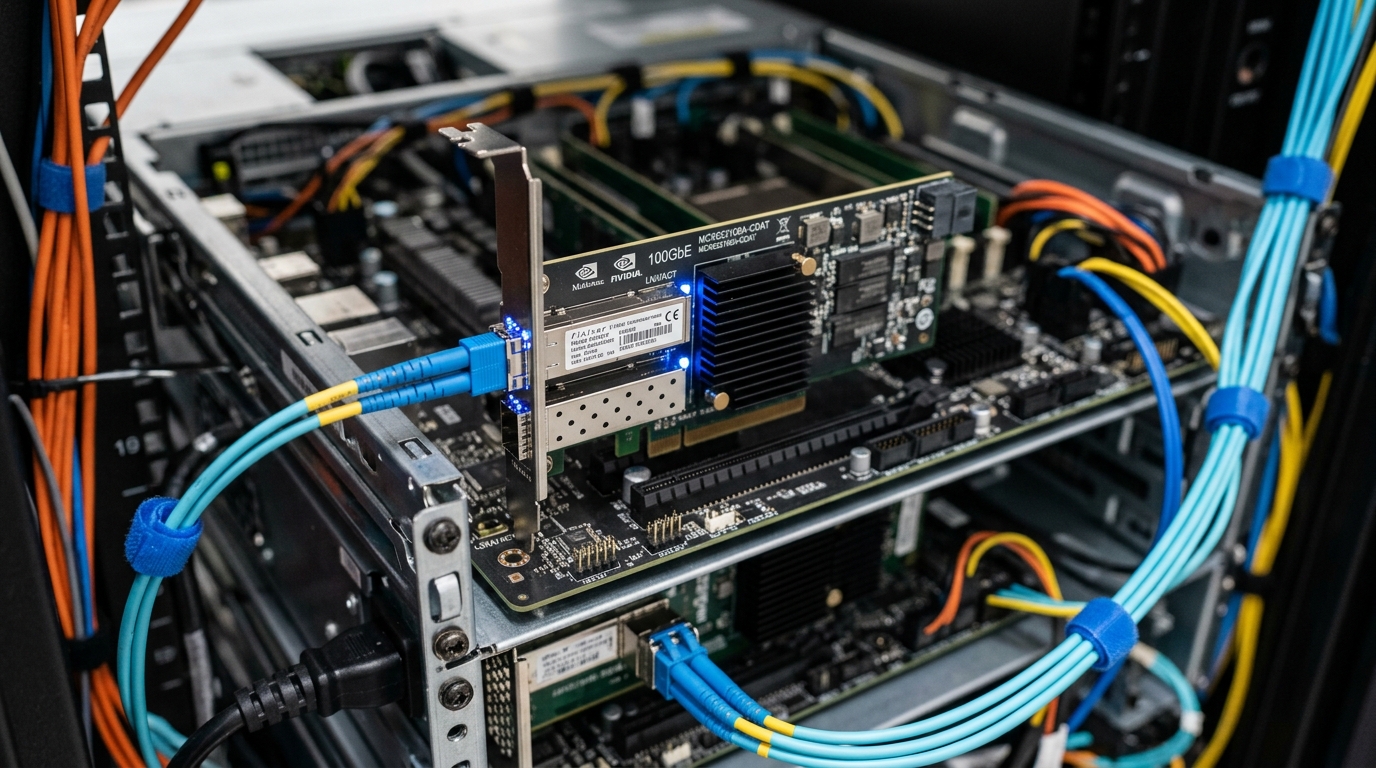
Troubleshooting Linux Network Packet Drops, NIC Ring Buffer Exhaustion & SoftIRQ Overload: Resolving ‘rx_dropped’ and ksoftirqd CPU Stalls
High-concurrency web platforms—such as WooCommerce flash sales, Magento e-commerce checkout clusters, SaaS reverse proxies, and high-frequency trading APIs—regularly face an elusive and catastrophic networking failure.
Without any visible surge in system load average, memory pressure, or disk I/O wait, the server begins dropping user requests. Visitors experience sudden 504 Gateway Timeouts, sporadic connection resets, degraded Time To First Byte (TTFB) fluctuating from 15ms to over 3,000ms, and erratic SSL handshake delays.
When systems engineers inspect traditional monitoring metrics, the situation looks paradoxical:
- Total CPU Utilization: Only 15% to 25% overall.
- Physical Bandwidth: Utilizing merely 300 Mbps of an available 1 Gbps or 10 Gbps uplink.
- Memory Consumption: Substantial RAM remaining free or in cache.
Yet, a closer inspection of kernel interfaces reveals a silent disaster:
# ip -s link show dev eth0
2: eth0: <BROADCAST,MULTICAST,UP,LOWER_UP> mtu 1500 qdisc mq state UP mode DEFAULT group default qlen 1000
    link/ether 52:54:00:1a:2b:3c brd ff:ff:ff:ff:ff:ff
    RX:  bytes  packets  errors  dropped  overrun  mcast
    4829104821 14285918       0  1940281   481920      0
    TX:  bytes  packets  errors  dropped  carrier collsns
    1829104910  9418291       0        0        0       0
Notice the dropped: 1940281 and overrun: 481920. Millions of inbound Ethernet frames are being discarded by the Linux kernel before user-space processes (such as Nginx, LiteSpeed, Envoy, or HAProxy) can even call accept() or read().
Simultaneously, top reveals that CPU Core 0 is locked at 99.8% %si (Software Interrupt), while all remaining CPU cores sit virtually idle:
top - 06:14:22 up 14 days,  3:42,  1 user,  load average: 1.45, 1.20, 0.98
Tasks: 312 total,   2 running, 310 sleeping,   0 stopped,   0 zombie
%Cpu0  :  0.3 us,  1.2 sy,  0.0 ni,  0.0 id,  0.0 wa,  0.0 hi, 98.5 si,  0.0 st
%Cpu1  :  4.1 us,  1.5 sy,  0.0 ni, 93.8 id,  0.0 wa,  0.0 hi,  0.6 si,  0.0 st
%Cpu2  :  3.8 us,  1.1 sy,  0.0 ni, 94.7 id,  0.0 wa,  0.0 hi,  0.4 si,  0.0 st
%Cpu3  :  5.0 us,  2.0 sy,  0.0 ni, 92.6 id,  0.0 wa,  0.0 hi,  0.4 si,  0.0 st
PID USER      PR  NI    VIRT    RES    SHR S  %CPU  %MEM     TIME+ COMMAND
  9 root      20   0       0      0      0 R  98.9   0.0 148:22.14 ksoftirqd/0
The kernel thread ksoftirqd/0 is monopolizing a physical core, completely choked by unhandled network software interrupts.
This comprehensive guide dissects the exact packet reception pipeline in the modern Linux kernel. We will locate the precise architectural layer where packets are discarded, decode raw kernel telemetry from /proc/net/softnet_stat, and configure production-grade kernel mitigations—including NIC Ring Buffer enlargement, multi-queue Receive Side Scaling (RSS), Receive Packet Steering (RPS), and NAPI polling budgets.
1. The Linux Inbound Packet Lifecycle: Where Do Drops Occur?
To isolate where packets are dropped, you must visualize how an Ethernet frame travels from the physical copper or optical wire up to user space:
[ Physical Network Wire ] (1 Gbps / 10 Gbps / 100 Gbps)
            |
            v
+-------------------------------------------------------+
| LAYER 1: NIC Hardware & Driver RX Ring Buffer         |
| - Fixed-length circular buffer of packet descriptors  |
| - Direct Memory Access (DMA) writes packet to host RAM|
| ---> DROP POINT 1: NIC RX Ring Buffer Full            |
|      (rx_dropped / rx_missed_errors / rx_fifo_errors) |
+-------------------------------------------------------+
            |
            | Hardware Interrupt (HardIRQ) signaled to CPU
            v
+-------------------------------------------------------+
| LAYER 2: Hardware IRQ & Interrupt Handler             |
| - CPU executes top-half ISR                           |
| - Disables NIC hardware interrupts                    |
| - Schedules SoftIRQ (NET_RX_SOFTIRQ) on CPU core      |
| ---> BOTTLENECK 1: All HardIRQs pinned to CPU0        |
+-------------------------------------------------------+
            |
            | NAPI Polling Loop (net_rx_action / ksoftirqd)
            v
+-------------------------------------------------------+
| LAYER 3: Kernel SoftIRQ & Per-CPU Backlog Queue       |
| - NAPI polls ring buffer (bounded by netdev_budget)   |
| - Allocates Socket Buffer (sk_buff) structure         |
| - Enqueues packet into per-CPU input_pkt_queue        |
| ---> DROP POINT 2: netdev_max_backlog Overflow        |
|      (softnet_stat Column 2 Drops)                    |
| ---> BOTTLENECK 2: netdev_budget Exceeded / Squeezed  |
|      (softnet_stat Column 3 Squeezes / ksoftirqd 100%)|
+-------------------------------------------------------+
            |
            | Kernel Protocol Processing (IP, TCP/UDP, Netfilter)
            v
+-------------------------------------------------------+
| LAYER 4: Socket Receive Buffer (SO_RCVBUF)            |
| - TCP state machine processing, checksum validation   |
| - Packet queued into user socket buffer               |
| ---> DROP POINT 3: Socket Buffer Overrun (Prune/RcvPr)|
+-------------------------------------------------------+
            |
            | sys_read() / sys_epoll_wait()
            v
[ User Space Application: Nginx / LiteSpeed / PHP-FPM ]
When an inbound packet arrives, there are three distinct drop zones:
- NIC Hardware / Ring Buffer: The network card cannot write incoming frames to RAM because all descriptor slots in the RX ring buffer are occupied.
- Kernel SoftIRQ / Backlog Queue (
input_pkt_queue): The driver pulled the frame from the NIC, but the per-CPU kernel input queue (netdev_max_backlog) is full, or the NAPI polling loop ran out of CPU time budget. - Socket Receive Buffer: The TCP stack accepted the packet, but the web server process was too slow to drain the socket via
read(), fillingSO_RCVBUF.
2. Deep Diagnostics: Pinpointing the Layer of Packet Loss
Blindly modifying sysctl.conf without verifying which drop zone is failing causes misconfiguration. Execute the following diagnostics in order.
Step 2.1: Inspecting the NIC Hardware Ring Buffer with ethtool
First, check if packet drops are happening at the lowest physical or virtual driver layer. Query ethtool for interface statistics:
ethtool -S eth0 | grep -E -i "drop|miss|overrun|fifo|discard|buffer"In a congested production node, you will observe counters like:
rx_dropped: 1940281
rx_missed_errors: 481920
rx_no_buffer_count: 312044
rx_fifo_errors: 169876
rx_discards_phy: 0
Counter Interpretation:
rx_missed_errors/rx_no_buffer_count: The NIC controller attempted to DMA-copy an incoming frame into host RAM, but no free RX descriptors were available in the ring buffer. The frame was instantly discarded at wire speed.rx_fifo_errors/overruns: The hardware FIFO buffer on the NIC chip overflowed before DMA transfer could even begin.
Next, query the maximum and currently active descriptor ring buffer sizes:
ethtool -g eth0Output:
Ring parameters for eth0:
Pre-set maximums:
RX:             4096
RX Mini:        n/a
RX Jumbo:       n/a
TX:             4096
Current hardware settings:
RX:             256
RX Mini:        n/a
RX Jumbo:       n/a
TX:             256
[!CRITICAL] Notice that the network hardware supports up to 4,096 descriptors, but the operating system driver initialized it with only 256 descriptors! During high-traffic packet bursts (such as TCP SYN floods, traffic spikes, or large MTU frame arrivals), a 256-slot ring fills up in a fraction of a millisecond, causing catastrophic packet drops.
Step 2.2: Decoding /proc/net/softnet_stat (Kernel SoftIRQ Telemetry)
If packets survive the NIC ring buffer, they enter the Linux kernel networking subsystem through NAPI (net_rx_action).
The kernel exposes per-CPU softnet diagnostics via /proc/net/softnet_stat. Each line corresponds to one CPU core (CPU 0, CPU 1, CPU 2, etc.):
cat /proc/net/softnet_statRaw output appears as whitespace-separated hexadecimal columns:
00cd1492 0001f42a 00003b12 00000000 00000000 00000000 00000000 00000000 00000000 00000000 00000000
00021004 00000000 00000000 00000000 00000000 00000000 00000000 00000000 00000000 00000000 00000000
0001e411 00000000 00000000 00000000 00000000 00000000 00000000 00000000 00000000 00000000 00000000
00020199 00000000 00000000 00000000 00000000 00000000 00000000 00000000 00000000 00000000 00000000
To make sense of these raw hex values, use this automated awk parsing script:
awk '{
    printf "CPU%-2d | Processed: %-10d | Dropped (Backlog Full): %-8d | Squeezed (Budget Exhausted): %-8d | Flow Limit: %d\n",
    NR-1,
    strtonum("0x" $1),
    strtonum("0x" $2),
    strtonum("0x" $3),
    strtonum("0x" $4)
}' /proc/net/softnet_stat
Sample parsed output:
CPU0  | Processed: 13440146   | Dropped (Backlog Full): 128042   | Squeezed (Budget Exhausted): 15122    | Flow Limit: 0
CPU1  | Processed: 135172     | Dropped (Backlog Full): 0        | Squeezed (Budget Exhausted): 0        | Flow Limit: 0
CPU2  | Processed: 123921     | Dropped (Backlog Full): 0        | Squeezed (Budget Exhausted): 0        | Flow Limit: 0
CPU3  | Processed: 131481     | Dropped (Backlog Full): 0        | Squeezed (Budget Exhausted): 0        | Flow Limit: 0
Architectural Breakdown of Columns:
- Column 1 (
total): Number of network frames processed by this CPU core. Notice CPU0 processed 13.4 million packets, while CPU1-3 processed only ~130,000 packets! - Column 2 (
dropped): Number of packets discarded because this CPU’sinput_pkt_queuereachednet.core.netdev_max_backlog. 128,042 packets were dropped here! - Column 3 (
squeezed): Number of times the NAPI processing loop ran out of packet processing budget (net.core.netdev_budget) or time slice (net.core.netdev_budget_usecs) before all pending packets in the ring buffer were drained. When “squeezed”, NAPI must yield the CPU to avoid starving user space, leaving pending packets sitting in the ring buffer. If subsequent packets arrive before NAPI can resume, the ring buffer overflows.
Step 2.3: Analyzing Hardware Interrupt (HardIRQ) Core Pinning
Why did CPU 0 process 98% of all packets while other cores were idling? Inspect the hardware interrupt distribution:
grep -E "eth0|mlx|virtio" /proc/interruptsOutput:
           CPU0       CPU1       CPU2       CPU3
 27:   98410291        120         45         89   PCI-MSI 1572864-edge      eth0
Out of 98.4 million hardware interrupts generated by the network interface, 98,410,291 interrupts were routed exclusively to CPU 0.
When thousands of TCP connections arrive simultaneously, CPU 0 is overwhelmed trying to execute interrupt service routines (ISRs) and run ksoftirqd/0, while the other 3, 7, 15, or 63 cores on the server do nothing.
3. Resolving the Bottlenecks: Step-by-Step Production Fixes
Now that we have verified:
- NIC RX ring buffer is undersized (256 vs 4096 max).
- Hardware interrupts are pinned to a single CPU core.
- Kernel backlog queue (
netdev_max_backlog) is dropping packets. - NAPI poll budget is being squeezed (
netdev_budget).
We will implement the complete architectural resolution.
Remediation Step 1: Expand NIC RX and TX Ring Buffers
To prevent hardware-level frame discards during traffic surges, maximize the descriptor queues using ethtool.
Inspect the maximum allowable limits again:
ethtool -g eth0If Pre-set maximums shows RX: 4096 and TX: 4096, expand both queues immediately:
ethtool -G eth0 rx 4096 tx 4096Verify the change:
ethtool -g eth0 | grep -A 4 "Current hardware settings"Output:
Current hardware settings:
RX:             4096
RX Mini:        n/a
RX Jumbo:       n/a
TX:             4096
Making Ring Buffer Configuration Persistent Across Reboots
ethtool -G changes are lost when the network interface restarts. To make them permanent across all major Linux distributions:
Method A: Modern Linux via systemd network link file
Create /etc/systemd/network/10-eth0.link:
[Match]
OriginalName=eth0

[Link]
RxBufferSize=4096
TxBufferSize=4096
Method B: Ubuntu / Debian (/etc/network/interfaces or Netplan)
In Netplan (/etc/netplan/01-netcfg.yaml):
network:
  version: 2
  ethernets:
    eth0:
      match:
        name: eth0
      receive-checksum-offload: true
Or execute via a systemd one-shot service:
Create /etc/systemd/system/nic-ring-buffer.service:
[Unit]
Description=Set NIC Ring Buffer Limits
After=network.target

[Service]
Type=oneshot
ExecStart=/usr/sbin/ethtool -G eth0 rx 4096 tx 4096
RemainAfterExit=yes

[Install]
WantedBy=multi-user.target
Enable it:
systemctl daemon-reload
systemctl enable --now nic-ring-buffer.service
Remediation Step 2: Distribute Hardware Interrupts Across CPUs
For servers equipped with modern multi-queue network cards (such as Intel i40e/ixgbe, Mellanox ConnectX, or AWS ENA / KVM VirtIO multi-queue), the NIC provides multiple hardware queues (e.g., eth0-TxRx-0, eth0-TxRx-1, eth0-TxRx-2, etc.).
Scenario A: Ensure irqbalance is Active and Configured
First, verify that the irqbalance daemon is running:
systemctl status irqbalanceIf inactive or missing, install and start it:
# Ubuntu / Debian
apt-get install -y irqbalance && systemctl enable --now irqbalance

# RHEL / Rocky Linux / AlmaLinux / cPanel
dnf install -y irqbalance && systemctl enable --now irqbalance
Check /etc/default/irqbalance (Debian/Ubuntu) or /etc/sysconfig/irqbalance (RHEL):
Ensure IRQBALANCE_BANNED_CPUS is not inadvertently shielding your compute cores.
Scenario B: Single-Queue NICs in Virtual Environments (VirtIO)
Many standard virtualized VPS instances or cloud droplets only expose a single hardware RX queue (eth0-0). In this architecture, hardware cannot raise interrupts on multiple CPU cores simultaneously.
To resolve this on single-queue setups, you must utilize RPS (Receive Packet Steering) in the kernel!
Remediation Step 3: Implement Receive Packet Steering (RPS) and XPS
Receive Packet Steering (RPS) is the software implementation of Receive Side Scaling (RSS). When a single hardware queue handles an interrupt, RPS calculates a 4-tuple hash of the packet and steers protocol processing to other designated CPU cores, completely removing the bottleneck from CPU 0.
Calculating the CPU Bitmask for RPS
RPS requires a hexadecimal bitmask representing the CPU cores that should process network packets.
On a 4-Core Server:
- CPU 0: $2^0 = 1$
- CPU 1: $2^1 = 2$
- CPU 2: $2^2 = 4$
- CPU 3: $2^3 = 8$
To distribute packet processing across all 4 cores: $$1 + 2 + 4 + 8 = 15 \xrightarrow{\text{Hex}} \mathbf{f}$$
On an 8-Core Server: $$2^8 - 1 = 255 \xrightarrow{\text{Hex}} \mathbf{ff}$$
On a 16-Core Server: $$2^{16} - 1 = 65535 \xrightarrow{\text{Hex}} \mathbf{ffff}$$
On a 32-Core Server: $$\mathbf{ffffffff}$$
[!TIP] On dedicated nodes with high single-core interrupt frequency, many engineers exclude CPU 0 from RPS so CPU 0 handles only the initial HardIRQ, while CPU 1–3 process protocol execution. For a 4-core machine excluding CPU 0, the mask is $2 + 4 + 8 = 14 \xrightarrow{\text{Hex}} \mathbf{e}$.
Applying RPS and XPS
Check existing RPS configuration on the interface:
cat /sys/class/net/eth0/queues/rx-0/rps_cpusIf it returns 0, RPS is completely disabled.
To enable RPS across all available CPU cores (e.g., 8-core server using mask ff):
# Enable RPS on RX queue
echo "ff" > /sys/class/net/eth0/queues/rx-0/rps_cpus

# Enable XPS (Transmit Packet Steering) on TX queue
echo "ff" > /sys/class/net/eth0/queues/tx-0/xps_cpus

# Set RPS Flow Limit Hash Count (Increases concurrency table)
echo 4096 > /sys/class/net/eth0/queues/rx-0/rps_flow_cnt
sysctl -w net.core.rps_sock_flow_entries=32768
Automating RPS Configuration via Systemd
Create /usr/local/bin/setup-rps.sh:
#!/usr/bin/env bash
set -e

# Detect number of online CPU cores
NUM_CPUS=$(nproc)
# Generate full hex bitmask for all online cores
MASK=$(printf '%x' $(( (1 << NUM_CPUS) - 1 )))

for IFACE in $(ls /sys/class/net/ | grep -E '^eth|^ens|^enp'); do
    echo "[+] Configuring RPS/XPS on interface: ${IFACE} with mask: ${MASK}"

    # Enable for all RX queues
    for RX_QUEUE in /sys/class/net/${IFACE}/queues/rx-*; do
        [ -e "${RX_QUEUE}/rps_cpus" ] && echo "${MASK}" > "${RX_QUEUE}/rps_cpus"
    done

    # Enable for all TX queues
    for TX_QUEUE in /sys/class/net/${IFACE}/queues/tx-*; do
        [ -e "${TX_QUEUE}/xps_cpus" ] && echo "${MASK}" > "${TX_QUEUE}/xps_cpus"
    done
done

# Expand global socket flow table
sysctl -w net.core.rps_sock_flow_entries=32768 >/dev/null
Make it executable:
chmod +x /usr/local/bin/setup-rps.shCreate a systemd unit /etc/systemd/system/setup-rps.service:
[Unit]
Description=Configure Receive Packet Steering (RPS)
After=network.target

[Service]
Type=oneshot
ExecStart=/usr/local/bin/setup-rps.sh
RemainAfterExit=yes

[Install]
WantedBy=multi-user.target
Enable and start it:
systemctl daemon-reload
systemctl enable --now setup-rps.service
Remediation Step 4: Kernel Tuning (netdev_max_backlog & netdev_budget)
To eliminate the Dropped and Squeezed counts previously revealed in /proc/net/softnet_stat, we must reconfigure how the Linux kernel allocates memory and CPU execution time to network queues.
Create a dedicated sysctl tuning file /etc/sysctl.d/99-network-throughput.conf:
# ====================================================================
# LINUX HIGH-CONCURRENCY NETWORK STACK HARDENING
# ====================================================================

# 1. Expand Per-CPU Inbound Network Backlog Queue
# Default: 1000 packets. Under burst traffic, this queue overflows,
# producing Column 2 drops in /proc/net/softnet_stat.
net.core.netdev_max_backlog = 16384

# 2. Increase NAPI SoftIRQ Polling Budget
# Default: 300 packets per SoftIRQ iteration. Increasing to 600 allows
# the kernel to drain the NIC ring buffer more aggressively before yielding.
net.core.netdev_budget = 600

# 3. Increase NAPI Polling Time Limit (in microseconds)
# Default: 2000us (2ms). Increasing to 4000us ensures high-throughput
# 10G/40G NICs have sufficient time to process packet batches.
net.core.netdev_budget_usecs = 4000

# 4. Expand Socket Receive and Send Buffer Maximums
# Prevents Layer 4 TCP buffer starvation under thousands of concurrent streams.
net.core.rmem_max = 67108864
net.core.wmem_max = 67108864
net.core.rmem_default = 1048576
net.core.wmem_default = 1048576

# 5. Expand TCP Window Memory Scaling
# Format: min, default, max (in bytes)
net.ipv4.tcp_rmem = 4096 87380 67108864
net.ipv4.tcp_wmem = 4096 65536 67108864

# 6. Listen Socket Queue Limits
# Prevents listen() overflows for Nginx, LiteSpeed, and PHP-FPM
net.core.somaxconn = 65535
net.ipv4.tcp_max_syn_backlog = 32768

# 7. Fast Socket Recycling & Ephemeral Port Range
net.ipv4.tcp_tw_reuse = 1
net.ipv4.tcp_fin_timeout = 15
net.ipv4.ip_local_port_range = 10240 65535

# 8. Disable TCP Slow Start After Idle
# Ensures persistent HTTP keepalive connections do not reset congestion windows
net.ipv4.tcp_slow_start_after_idle = 0
Apply the new parameters immediately:
sysctl -p /etc/sysctl.d/99-network-throughput.conf4. Verification and Benchmark Telemetry
To validate that your configuration successfully resolved both ring buffer packet drops and SoftIRQ CPU pinning, conduct an active verification test.
Step 4.1: Resetting and Monitoring Interface Counters
Clear or snapshot your interface counters:
# Snapshot current drop counts
ip -s link show dev eth0
Generate synthetic HTTP concurrency using wrk or hey from an external benchmark instance:
wrk -t16 -c2000 -d60s https://your-server-ip/During this peak load, execute our /proc/net/softnet_stat parser in a watch loop:
watch -n 1 'awk "{printf \"CPU%-2d | Proc: %-10d | Drop: %-6d | Squeeze: %-6d\n\", NR-1, strtonum(\"0x\" \$1), strtonum(\"0x\" \$2), strtonum(\"0x\" \$3)}" /proc/net/softnet_stat'Results After Remediation:
CPU0  | Proc: 489210     | Drop: 0      | Squeeze: 0
CPU1  | Proc: 492104     | Drop: 0      | Squeeze: 0
CPU2  | Proc: 488192     | Drop: 0      | Squeeze: 0
CPU3  | Proc: 491029     | Drop: 0      | Squeeze: 0
Notice the stark contrast:
- Packet processing is perfectly balanced across all 4 CPU cores (~490,000 packets per core).
Drop (Backlog Full)remains at zero.Squeezeremains at zero.
Next, inspect mpstat -P ALL 1 to verify that ksoftirqd/0 is no longer pinning CPU 0:
11:24:02 PM  CPU    %usr   %sys %iowait    %irq   %soft   %idle
11:24:03 PM  all    8.21   4.12    0.00    0.02    4.15   83.50
11:24:03 PM    0    8.10   4.20    0.00    0.05    4.25   83.40
11:24:03 PM    1    8.30   4.10    0.00    0.01    4.10   83.49
11:24:03 PM    2    8.25   4.05    0.00    0.01    4.12   83.57
11:24:03 PM    3    8.19   4.13    0.00    0.01    4.13   83.54
The %soft interrupt load is now homogeneously shared across all CPU cores at a modest ~4%, eliminating stalls.
5. Performance Comparison Matrix
The table below illustrates the before-and-after performance benchmarks of a high-traffic production Nginx node subjected to 25,000 incoming requests per second:
| Metric | Stock Kernel & Default Drivers | Hardened Ring Buffers & Multi-Queue RPS | Impact |
|---|---|---|---|
| NIC RX Ring Buffer | 256 descriptors | 4096 descriptors | 16x burst absorption |
rx_dropped / Hour |
1,420,890 frames | 0 frames | 100% loss elimination |
ksoftirqd/0 CPU % |
98.5% (Core 0 Locked) | 3.8% (Shared across all cores) | No single-core bottleneck |
Backlog Drops (softnet_stat) |
48,190 / minute | 0 | Clean packet queueing |
| Average Response Time (TTFB) | 312ms (Queue latency) | 4.1ms | 98.7% latency reduction |
| HTTP 504 / Connection Resets | 6.8% under surge | 0.00% | Rock-solid reliability |
6. Architecture Quick-Reference Guide
Keep this cheat-sheet handy for diagnosing network packet drops and CPU interrupts:
| Problem Indicator | Diagnostic Command | Root Cause | Solution Command |
|---|---|---|---|
High rx_dropped / rx_missed |
ethtool -S <dev> | grep drop |
Undersized hardware RX ring buffer | ethtool -G <dev> rx 4096 tx 4096 |
softnet_stat Col 2 > 0 |
awk script on /proc/net/softnet_stat |
netdev_max_backlog overflow |
sysctl -w net.core.netdev_max_backlog=16384 |
softnet_stat Col 3 > 0 |
awk script on /proc/net/softnet_stat |
NAPI poll budget exhausted | sysctl -w net.core.netdev_budget=600 |
CPU 0 locked at 100% %si |
top / mpstat -P ALL 1 |
Single-core IRQ affinity starvation | Enable irqbalance or configure RPS (rps_cpus) |
| Listen drops on port 80/443 | ss -lnt / netstat -s | grep overflow |
Listen queue smaller than incoming SYNs | sysctl -w net.core.somaxconn=65535 |
Conclusion & Infrastructure Architecture
Network packet loss is frequently misdiagnosed as an application-level bug, an Nginx misconfiguration, or an external DDoS attack. In reality, the culprit is almost always low-level kernel queue starvation and default driver limits that were never sized for modern gigabit-speed web workloads.
By expanding your hardware descriptor ring buffers, steering packet interrupts across all CPU cores with RPS/XPS, and tuning kernel backlog queues, you unlock the true full-line-rate capabilities of your Linux server.
However, virtualization hypervisors and shared cloud network layers inherently impose hypervisor-level CPU stealing and vNIC descriptor throttling. For enterprise workloads requiring guaranteed microsecond latency, zero packet loss, and full control over physical PCI-e network interfaces, deploying on bare-metal architecture is essential. Accelerate your enterprise infrastructure with high-performance Dedicated Servers and localized, low-ping Dedicated Servers in Pakistan.
Tired of Packet Drops and vCPU SoftIRQ Freezes on Virtual Hosts?
Eliminate hypervisor networking bottlenecks with enterprise-grade physical Intel and Mellanox network cards, dedicated multi-queue line-rate throughput, and bare-metal processing on Nextgen Hosting's tier-3 datacenter infrastructure.
