
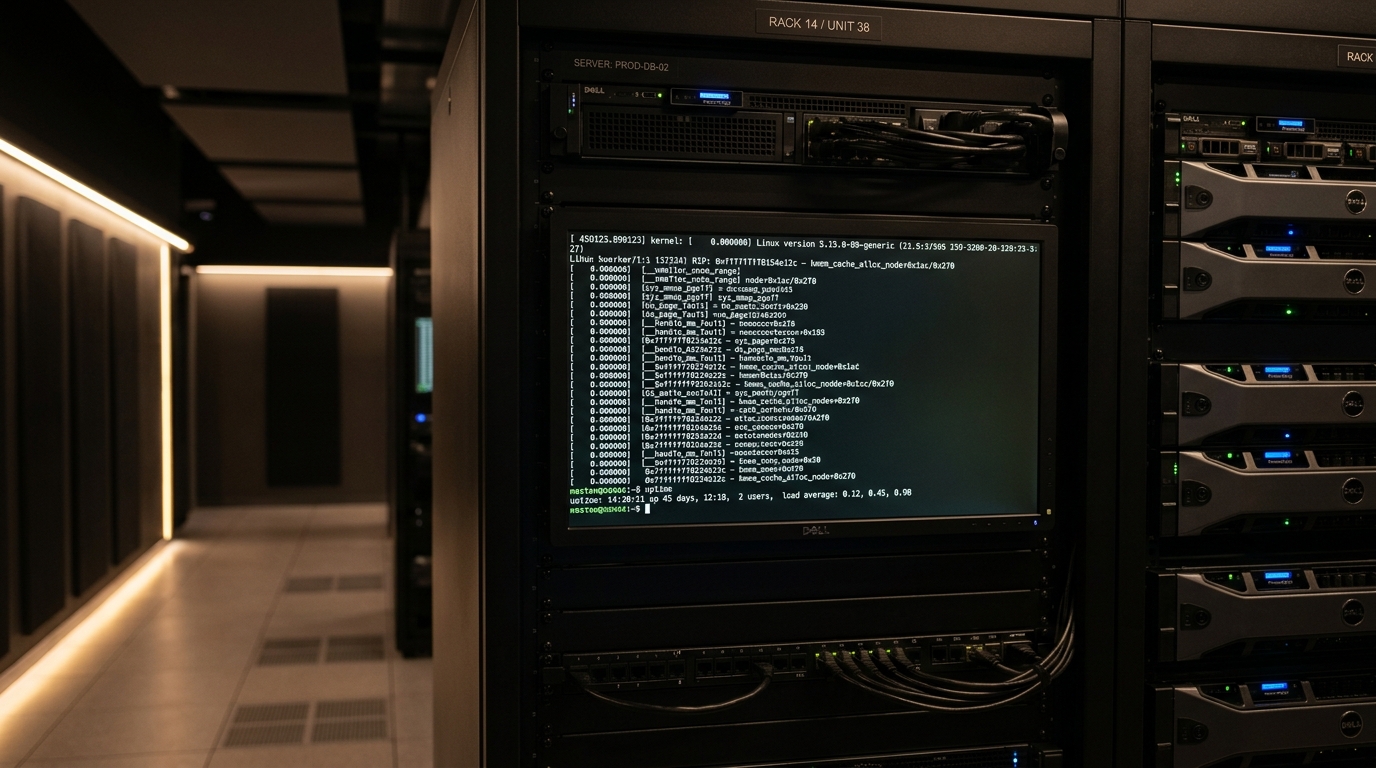
When managing multi-tenant cPanel/WHM hosting nodes, high-traffic MySQL/MariaDB database clusters, or busy containerized microservices, few incidents cause as much operational paralysis as a process frozen in uninterruptible sleep. System administrators observe an escalating load average—surging past 40, 80, or even 200—while total CPU utilization registers near zero. Standard troubleshooting commands begin hanging, application threads freeze, and the Linux kernel begins flooding the console ring buffer with ominous telemetry:
kernel: INFO: task mysqld:28491 blocked for more than 120 seconds.
kernel:       Not tainted 6.6.0-14-generic #15-Ubuntu
kernel: "echo 0 > /proc/sys/kernel/hung_task_timeout_secs" disables this message.
kernel: task:mysqld          state:D stack:0     pid:28491 ppid:1      flags:0x00000000
kernel: Call Trace:
kernel:  <TASK>
kernel:  __schedule+0x3cb/0x14d0
kernel:  schedule+0x5a/0xc0
kernel:  io_schedule+0x46/0x70
kernel:  wait_on_page_bit_common+0x12c/0x3a0
kernel:  __filemap_fdatawait_range+0x103/0x150
kernel:  filemap_write_and_wait_range+0x6d/0xa0
kernel:  ext4_sync_file+0x13c/0x3b0
kernel:  do_fsync+0x3b/0x70
kernel:  __x64_sys_fdatasync+0x17/0x20
kernel:  do_syscall_64+0x5b/0x90
kernel:  entry_SYSCALL_64_after_hwframe+0x6e/0xd8
kernel:  </TASK>
Attempting to terminate the offending process with kill -9 <PID> does nothing. The process persists in the process table, completely unresponsive to signals, locking shared resources and elevating load averages.
This diagnostic runbook covers the internal Linux scheduler mechanics governing the TASK_UNINTERRUPTIBLE state, breaks down the four root causes of hung tasks, provides step-by-step diagnostic workflows, and details permanent kernel and infrastructure remediations.
1. Process State Internals: Why Does ‘kill -9’ Fail on D State Tasks?
In the Linux process lifecycle, every task managed by the Completely Fair Scheduler (CFS) or Earliest Eligible Virtual Deadline First (EEVDF) scheduler resides in one of several well-defined states:
                            ┌────────────────────────┐
                            │    TASK_RUNNING (R)    │
                            │  Executing or on CPU   │
                            │       runqueue         │
                            └───────────┬────────────┘
                                        │
                 Initiates Blocking     │     Resource Becomes Available
                 System Call            │     or Event Occurs
                                        ▼
             ┌──────────────────────────────────────────────────────┐
             │                   Sleeping State                     │
             ├──────────────────────────┬───────────────────────────┤
             │   TASK_INTERRUPTIBLE (S) │ TASK_UNINTERRUPTIBLE (D)  │
             │   Woken by signals or    │ Ignores all signals until │
             │   timer events           │ hardware I/O / lock clears│
             └──────────────────────────┴───────────────────────────┘
Standard sleeping processes reside in TASK_INTERRUPTIBLE (S in top and ps). In this state, the process waits for an event—such as incoming network socket data, a timer expiration, or terminal input. If the kernel delivers an asynchronous POSIX signal (such as SIGTERM or SIGKILL), the scheduler awakens the task immediately, unblocks it from the wait queue, and executes the signal handler or terminates the process.
In stark contrast, TASK_UNINTERRUPTIBLE (D state) is an intentional kernel safety invariant. When a thread issues a system call requiring direct coordination with physical storage hardware or atomic kernel locks (such as writing dirty pages to disk, committing an ext4 journal, or traversing a VFS inode lock), the kernel places the thread into TASK_UNINTERRUPTIBLE.
The Signal Deferral Mechanics
When a thread enters TASK_UNINTERRUPTIBLE:
- The kernel sets
p->state = TASK_UNINTERRUPTIBLEand invokesschedule()orio_schedule(). - The scheduler context-switches the CPU core away to execute another runnable task.
- Crucially, the kernel scheduler completely skips signal evaluation for tasks in this state. The task’s
pending_signalsbitmap is updated when you issuekill -9 <PID>, but the kernel will not evaluate or act on those signals until the hardware interrupt handler signals completion and returns the task toTASK_RUNNING. - If the underlying hardware device fails to respond, or if a network filesystem loses its RPC connection, the completion interrupt never arrives.
- Consequently, the process remains suspended in kernel space indefinitely. It cannot be killed, paused, or restarted without clearing the underlying blockage or rebooting the operating system.
Furthermore, Linux calculates system load averages using an algorithm that counts both runnable threads (TASK_RUNNING) and uninterruptible sleeping threads (TASK_UNINTERRUPTIBLE). This design choice reflects true demand for system hardware resources: a machine with 50 processes blocked waiting on saturated storage is under severe hardware distress, even if CPU cores are idle.
2. The 4 Underlying Root Causes of Hung D-State Tasks
Uninterruptible sleep is rarely a bug in user-space applications like Apache, Nginx, or MySQL. It is almost exclusively an indicator of acute hardware distress, network storage transport loss, or kernel memory buffer exhaustion.
Root Cause 1: Storage Hardware and Controller Timeouts
When storage controllers (SATA, SAS, or NVMe) encounter read/write failures, media degradation, bad blocks, or PCIe transport bus hangs, the device driver initiates hardware retries.
- Saturated Disk Queues: When queue depths saturate and disk service times (
w_awaitorr_awaitiniostat) spike from 2 milliseconds to over 1,500 milliseconds, processes executing synchronous I/O operations (fsync,fdatasync, direct I/O) stack up inio_schedule(). - Failing Physical Storage: Solid-state drive controllers encountering NAND block exhaustion or enterprise SAN/NAS arrays undergoing controller failover often freeze I/O execution for 30 to 180 seconds.
- Hypervisor I/O “Noisy Neighbors”: In multi-tenant virtualized cloud environments, if neighboring virtual machines monopolize shared block storage or SAN IOPS, guest OS I/O requests are delayed past the kernel hung task threshold.
Root Cause 2: Hung NFS and Remote Network Storage Mounts
Network File System (NFS), CephFS, and GlusterFS shares mounted with default or improper mount options represent the single most common cause of permanent D state processes:
- The
hardMount Trap: By default, enterprise NFS shares are mounted with thehardflag. When the remote NFS server goes offline, reboots, or suffers an IP routing failure, the NFS client kernel refuses to abort the I/O request or return anEIOerror to the application. Instead, it enters an infinite retry loop. - Cascading File Lockups: Any process attempting to read a path, run
ls -la, check disk usage (df -h), or close a file descriptor pointing to that mount point entersTASK_UNINTERRUPTIBLEimmediately and indefinitely.
Root Cause 3: Dirty Page Writeback Throttling
Linux employs aggressive page caching to maximize write performance. When applications write to files, the data is initially committed to RAM as “dirty pages.” A background kernel thread pool (kworker flush threads) flushes these dirty pages asynchronously to underlying block devices.
However, if write volume outpaces the physical disk’s throughput:
- The dirty memory threshold crosses
vm.dirty_background_ratio(default 10%), activating background kernel flushing. - If write volume continues to surge and reaches
vm.dirty_ratio(default 20% to 30%), the kernel triggers synchronous writeback throttling. - Under synchronous throttling, any user-space process calling
write()orsendfile()is forcibly halted, transitioned intoDstate, and forced to assist in flushing dirty pages to disk before it is allowed to write another single byte. - If the server has 256 GB of RAM, a 20% dirty ratio permits over 50 GB of unwritten data to accumulate. Flushing 50 GB to an overloaded disk or slow array can take several minutes, during which all database and web services seize completely.
Root Cause 4: Filesystem Journaling Lockups
Modern journaling filesystems (EXT4 and XFS) use transactional logs (JBD2 in EXT4, xfslog in XFS) to guarantee filesystem consistency.
- When a transactional commit begins, the filesystem acquires locks across inode structures and metadata blocks.
- If the journal commit thread (
jbd2/dm-0-8orxfsaild) blocks due to underlying storage latency, every application thread requesting inode allocation or metadata modifications blocks on the filesystem mutex. - The resulting trace frequently shows wait channels such as
jbd2_log_wait_commit,xfs_buf_lock, orwait_on_buffer.
3. Step-by-Step Diagnostic Runbook
When a server alerts on high load or blocked tasks, execute this sequential diagnostic runbook to isolate the culprit.
                             [ High Load / Hung Alert ]
                                         │
                                         ▼
                             Run: ps -eo pid,stat,wchan
                                         │
                   ┌─────────────────────┴─────────────────────┐
                   ▼                                           ▼
       Wait Channel: io_schedule,                 Wait Channel: rpc_wait_bit,
       ext4_sync, jbd2_wait                       nfs_wait_bit
                   │                                           │
                   ▼                                           ▼
          Storage Subsystem                          Network Mount Failure
        - Run: iostat -xz 1                        - Check: mount -v | grep nfs
        - Check: %util, w_await > 1000ms           - Execute: umount -l /mount
        - Run: iotop -oPa                          - Restore RPC / Network Path
                   │
                   ▼
       Dirty Page Saturation?
       - Check: cat /proc/meminfo | grep Dirty
       - Apply sysctl writeback tuning
Step 1: Enumerate All D-State Tasks and Their Wait Channels
Identify all processes currently trapped in uninterruptible sleep, their process IDs, owners, execution commands, and exact kernel wait channels:
ps -eo pid,user,stat,wchan:25,comm | grep -E '^ *[0-9]+ +[^ ]+ +D'Sample output:
 14829 mysql     D    io_schedule_timeout       mysqld
 14830 mysql     D    ext4_sync_file            mysqld
 18241 www-data  D    nfs_wait_bit_uninterrupti php-fpm
 21094 root      D    jbd2_log_wait_commit      jbd2/nvme0n1p2-
 24102 cpanel    D    sync_inodes_sb            tar
The wchan column reveals the specific kernel function where the task is sleeping:
io_schedule/io_schedule_timeout: Waiting for block I/O hardware response.ext4_sync_file/jbd2_log_wait_commit: Blocked on ext4 metadata/journal writes.nfs_wait_bit_uninterruptible/rpc_wait_bit: Blocked on unresponsive remote network storage.sync_inodes_sb: Blocked flushing dirty inode buffers.
Step 2: Extract Deep Kernel Call Stacks via /proc
Once you have identified the PID, inspect the precise kernel stack trace to pinpoint the blocking system call:
cat /proc/14829/stackSample kernel stack output:
[<0>] io_schedule+0x46/0x70
[<0>] wait_on_page_bit_common+0x12c/0x3a0
[<0>] __filemap_fdatawait_range+0x103/0x150
[<0>] filemap_write_and_wait_range+0x6d/0xa0
[<0>] ext4_sync_file+0x13c/0x3b0
[<0>] do_fsync+0x3b/0x70
[<0>] __x64_sys_fdatasync+0x17/0x20
[<0>] do_syscall_64+0x5b/0x90
[<0>] entry_SYSCALL_64_after_hwframe+0x6e/0xd8
This stack confirms that MySQL is executing an fdatasync() system call (committing transactions from its InnoDB redo log to disk) and is waiting on io_schedule inside the ext4 layer. The bottleneck is direct physical storage write latency.
Step 3: Trigger a Kernel-Wide Blocked Task Dump via SysRq
When multiple interconnected services are locked up, trigger a kernel-level backtrace dump of every blocked task across the entire system:
# Enable all SysRq functions temporarily
echo 1 > /proc/sys/kernel/sysrq

# Trigger blocked task state dump
echo w > /proc/sysrq-trigger

# Read the kernel log ring buffer with human-readable timestamps
dmesg -T | grep -A 20 "Call Trace:"
This command dumps the stack trace of every single thread residing in D state directly into the kernel ring buffer, exposing lock contention hierarchies where multiple threads are blocked behind a single shared mutex.
Step 4: Isolate Storage Subsystem Saturation with iostat and iotop
To confirm whether hardware queue congestion or disk saturation is causing the hang, run iostat with 1-second intervals:
iostat -xz 1Examine the output carefully:
Device            r/s     w/s     rkB/s     wkB/s  rrqm/s  wrqm/s  %rrqm  %wrqm  r_await  w_await  aqu-sz  rareq-sz  wareq-sz  svctm  %util
sda              4.00 1250.00     16.00  84210.00    0.00  412.00   0.00  24.79     1.20  1450.80   45.20      4.00     67.37   0.80 100.00
nvme0n1         12.00  980.00    128.00  62400.00    0.00  120.00   0.00  10.91     0.45     1.12    0.80     10.67     63.67   0.05   4.80
Key diagnostic thresholds:
%util= 100.00%: The physical device is saturated and running at continuous maximum capacity.w_await> 1000.00 ms: Disk write requests are spending over 1.4 seconds in the queue waiting for physical completion. For healthy enterprise storage,w_awaitmust remain below 5.0 ms.aqu-sz(Average Queue Size) > 20: Indicates substantial command backlog queuing up at the block driver layer.
To determine which specific processes are driving this I/O load, execute iotop filtered to active I/O threads and accumulated totals:
iotop -oPa4. Remediation and Production Kernel Tuning
Remediating Dead Network Mounts (NFS / CephFS)
If the wait channel indicates nfs_wait_bit_uninterruptible, the task is locked waiting on an unresponsive remote mount point. Attempting standard umount /mnt/nfs will fail and hang the calling terminal.
Execute an emergency unmount:
# Force unmount (attempts to tear down active RPC sessions)
umount -f /mnt/nfs

# If umount -f hangs or fails, execute a lazy unmount immediately
umount -l /mnt/nfs
The -l (lazy unmount) flag immediately detaches the filesystem from the directory hierarchy, preventing any new processes from accessing the hung mount. Outstanding TASK_UNINTERRUPTIBLE tasks are cleared as pending network packets are canceled or allowed to expire.
For permanent resilience, ensure network shares are mounted in /etc/fstab with timeout protections:
# Hard mount with soft timeout fallback, reduced RPC timeout (timeo=30 = 3 seconds), and retrans limit
192.168.10.50:/exports/data /mnt/nfs nfs rw,hard,intr,timeo=30,retrans=3,actimeo=10 0 0
Tuning Kernel Hung Task Monitoring
By default, the Linux kernel monitors for tasks stuck in D state for more than 120 seconds (CONFIG_DETECT_HUNG_TASK). On overloaded production systems, you can configure how the kernel alerts on or handles these lockups.
Create /etc/sysctl.d/99-hung-task.conf:
# Time in seconds before alerting on a blocked task (default: 120)
kernel.hung_task_timeout_secs = 120

# Do NOT kernel panic on hung task detection in production (0 = log only, 1 = panic)
kernel.hung_task_panic = 0

# Limit maximum hung task warnings per boot to prevent syslog saturation
kernel.hung_task_warnings = 10
Apply immediately without rebooting:
sysctl --systemEliminating Dirty Page Writeback Freezes
On systems equipped with substantial physical memory (64 GB to 512 GB RAM), default virtual memory parameters allow enormous volumes of dirty data to build up before flushing. When the kernel finally initiates flush operations, high-concurrency applications experience violent latency spikes.
Configure proactive, continuous background flushing to eliminate write freezes:
Create /etc/sysctl.d/99-virtual-memory.conf:
# Begin proactive background flushing as soon as dirty pages reach 5% of RAM
vm.dirty_background_ratio = 5

# Hard limit: Force processes to wait if dirty pages reach 10% of RAM
vm.dirty_ratio = 10

# Expire dirty pages after 30 seconds (3000 centiseconds)
vm.dirty_expire_centisecs = 3000

# Wake up flusher daemons every 5 seconds (500 centiseconds)
vm.dirty_writeback_centisecs = 500

# Prevent aggressive swapping during memory-intensive write operations
vm.swappiness = 10
For high-memory database servers with >128 GB RAM, ratio-based configurations can still allow 12 GB+ of dirty pages. Use absolute byte limits instead:
# Start flushing at 1 GB of dirty pages
vm.dirty_background_bytes = 1073741824

# Forcibly throttle writers at 4 GB of dirty pages
vm.dirty_bytes = 4294967296
Apply the changes:
sysctl --system5. Architectural Comparison: Cloud Virtualization vs. Bare-Metal NVMe
While software-level sysctl optimizations alleviate queue congestion, they cannot overcome the fundamental physical constraints of shared multi-tenant cloud storage.
┌────────────────────────────────────────────────────────┐
│             Multi-Tenant Cloud Storage (VPS)           │
│                                                        │
│  [Tenant A: DB]    [Tenant B: Backup]   [Tenant C: Mining]
│        │                   │                    │
│        ▼                   ▼                    ▼
│  Virtual SCSI        Virtual SCSI         Virtual SCSI
│        │                   │                    │
│        └───────────────────┼────────────────────┘
│                            │
│                 Shared Hypervisor SAN / Ceph
│                 - High Latency Jitter (10-150ms)
│                 - Noisy Neighbor IOPS Throttling
│                 - Vulnerable to D-State Cascades
└────────────────────────────────────────────────────────┘

                           VERSUS

┌────────────────────────────────────────────────────────┐
│             Dedicated Enterprise Bare-Metal            │
│                                                        │
│  [Enterprise Workloads / Databases / cPanel Accounts]  │
│                            │                           │
│                            ▼                           │
│              Direct PCIe Gen4/Gen5 NVMe Bus            │
│                            │                           │
│              Hardware Hardware Queues (blk-mq)         │
│              - Sub-millisecond latency (<0.05ms)
│              - 1,000,000+ Deterministic IOPS
│              - Zero Hypervisor Contention / 0% iowait
└────────────────────────────────────────────────────────┘| Performance Dimension | Multi-Tenant Virtualized Storage | Bare-Metal PCIe Gen4/Gen5 NVMe RAID |
|---|---|---|
I/O Latency (w_await) |
Variable (5.0 ms – 1,200 ms during contention) | Deterministic (< 0.08 ms under peak load) |
| IOPS Capacity | Capped per tenant (typically 3,000 – 15,000 IOPS) | Full physical throughput (1,000,000+ IOPS) |
| Noisy Neighbor Contention | High (SAN/NAS shared across hundreds of VMs) | Zero (Dedicated hardware bus, isolated hardware) |
Risk of D State Lockups |
Moderate to High during SAN/Hypervisor stalls | Extremely low (Hardware-level queue isolation) |
| Storage Architecture | Network-attached or virtualized abstraction | Direct-attached NVMe via PCIe Gen4/Gen5 lanes |
High-transaction MySQL/PostgreSQL databases, large cPanel web hosting clusters running hundreds of WordPress sites, and high-volume WooCommerce checkouts inevitably outgrow virtualized shared storage environments. When a hypervisor SAN or virtual block device locks up, transactional threads rapidly freeze into uninterruptible sleep.
To guarantee zero hypervisor storage jitter and sub-millisecond database commit times, mission-critical infrastructure demands bare-metal Dedicated Servers. For enterprise organizations and financial applications operating within domestic latency boundaries, deploying hardware-isolated Dedicated Servers in Pakistan backed by direct enterprise NVMe storage arrays in Tier-3 facilities delivers the deterministic I/O performance required to permanently eliminate kernel hung task bottlenecks.
6. Emergency Recovery Checklist
When a server is actively locked in D state and SSH access is deteriorating:
# 1. Quickly confirm count of trapped D-state tasks
ps -eo stat | grep -c '^D'

# 2. Check current dirty memory backlog
cat /proc/meminfo | grep -E 'Dirty|Writeback'

# 3. Terminate non-critical I/O heavy processes (e.g., backups, indexers)
killall -9 rsync tar gzip mysqldump 2>/dev/null

# 4. Trigger an immediate synchronous disk flush
sync

# 5. Lazily unmount all unresponsive network shares
umount -a -t nfs,nfs4 -l

# 6. If storage hardware is frozen and server fails to cleanly reboot:
# Safely sync and reboot via kernel SysRq triggers
echo 1 > /proc/sys/kernel/sysrq
echo s > /proc/sysrq-trigger   # Emergency Sync dirty pages
echo u > /proc/sysrq-trigger   # Emergency Read-Only remount
echo b > /proc/sysrq-trigger   # Emergency Immediate Reboot
By systematically tracing wait channels through /proc/<PID>/stack, proactively flushing dirty pages via tuned vm.dirty_* parameters, and backing high-throughput workloads with dedicated bare-metal NVMe arrays, system engineers can eliminate uninterruptible sleep lockups and maintain reliable system availability.
Eliminate I/O Bottlenecks with Bare-Metal NVMe Performance
Protect your mission-critical applications from virtualized noisy neighbors and storage lockups with dedicated enterprise hardware featuring direct PCIe Gen4/Gen5 NVMe RAID arrays.
