
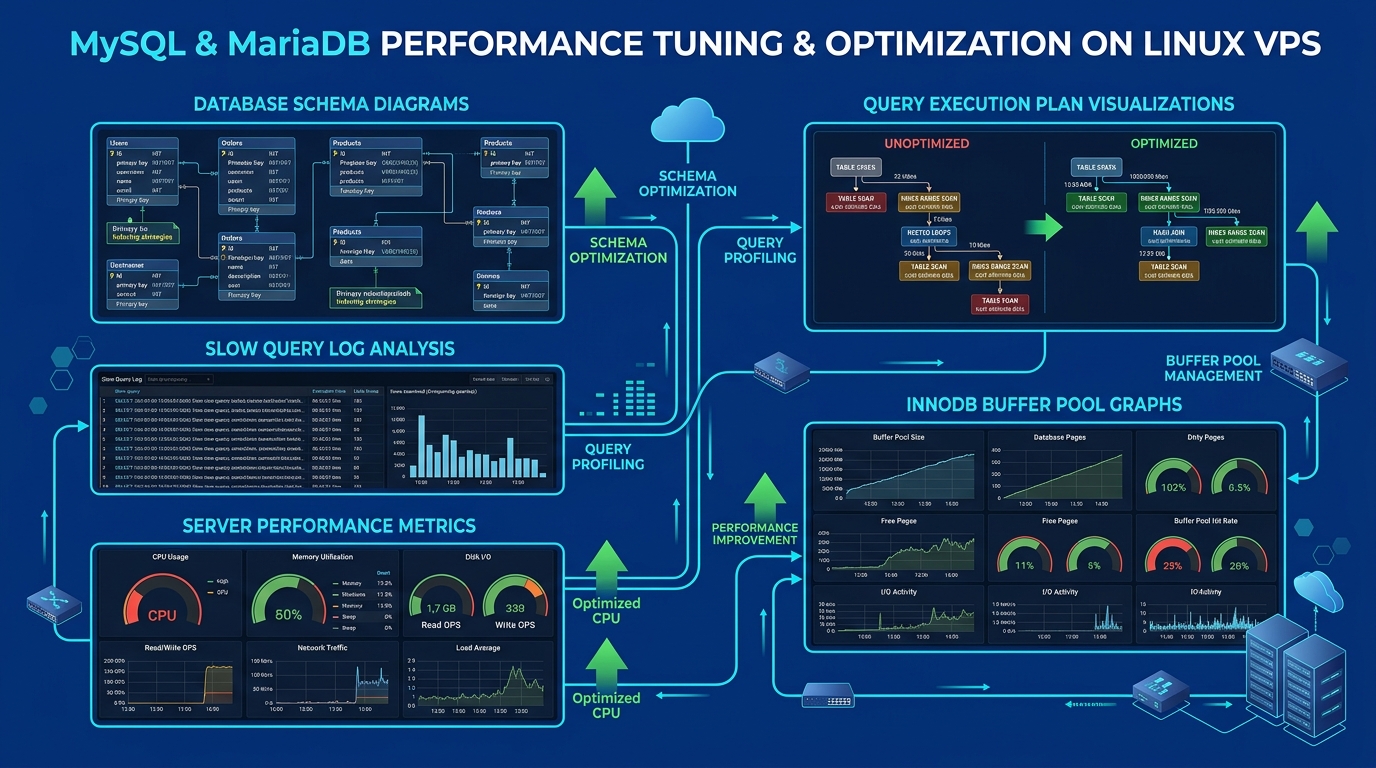
A poorly tuned MySQL or MariaDB installation is the most common root cause of slow WordPress, WooCommerce, Magento, and custom application performance on VPS hosting — often contributing 60–80% of total server response time even when NGINX and PHP are optimally configured.
This guide covers every critical database tuning parameter, from InnoDB buffer pool sizing to index cardinality analysis, with configurations benchmarked on Pakistan NVMe VPS instances running MariaDB 11.x and MySQL 8.0.
Step 1: Establish Your Baseline with the Slow Query Log
Before tuning anything, enable the slow query log to identify your actual bottlenecks:
-- Enable in MySQL/MariaDB runtime (no restart needed)
SET GLOBAL slow_query_log = 'ON';
SET GLOBAL long_query_time = 1;
SET GLOBAL slow_query_log_file = '/var/log/mysql/slow.log';
SET GLOBAL log_queries_not_using_indexes = 'ON';
Or persist in /etc/mysql/my.cnf:
[mysqld]
slow_query_log = 1
long_query_time = 1
slow_query_log_file = /var/log/mysql/slow.log
log_queries_not_using_indexes = 1
Analyze the slow query log with pt-query-digest from Percona Toolkit:
pt-query-digest /var/log/mysql/slow.log | head -100This identifies your top-10 slowest query patterns in minutes — focus all optimization effort here first before touching global server variables.
Step 2: InnoDB Buffer Pool — The Most Critical Setting
The InnoDB buffer pool is MySQL’s primary RAM cache for table data and indexes. The default is a catastrophically low 128MB on most installations:
[mysqld]
# Set to 70-80% of available RAM for dedicated DB servers
# On a 4GB VPS: set to 3G
# On an 8GB VPS: set to 6G
innodb_buffer_pool_size = 3G

# Enable multiple instances for parallel access (1 per GB of buffer pool)
innodb_buffer_pool_instances = 3

# Increase log file size for write-heavy workloads
innodb_log_file_size = 512M
innodb_log_buffer_size = 64M

# Flush method for NVMe/SSD storage
innodb_flush_method = O_DIRECT
innodb_flush_log_at_trx_commit = 2
innodb_flush_log_at_trx_commit = 2 trades strict ACID durability for a significant write performance gain — acceptable for most web applications where a 1-second data loss window on crash is tolerable.
Step 3: Connection Pool and Thread Tuning
Each MySQL connection consumes RAM. Misconfigured connection limits cause “Too many connections” errors on high-traffic sites:
[mysqld]
max_connections = 200
max_connect_errors = 10000
wait_timeout = 60
interactive_timeout = 60
thread_cache_size = 50

# For MariaDB with thread pool plugin
thread_handling = pool-of-threads
thread_pool_size = 8
thread_pool_max_threads = 200
The MariaDB thread pool (pool-of-threads) dramatically outperforms the default one-thread-per-connection model under burst traffic — essential for WordPress sites running multiple concurrent visitors.
Step 4: Query Cache (MariaDB) vs. ProxySQL Caching
MySQL 8.0 removed the built-in query cache entirely. For MariaDB 10.x/11.x, the query cache helps read-heavy workloads:
[mysqld]
query_cache_type = 1
query_cache_size = 256M
query_cache_limit = 2M
query_cache_min_res_unit = 2k
For MySQL 8.0, implement application-level caching via Redis or use ProxySQL for transparent query result caching between your application and database layers. This is covered in detail in our Docker container optimization guide.
Step 5: Index Optimization — Finding and Fixing Missing Indexes
Missing indexes are responsible for the majority of slow queries. Identify them with:
-- Find queries using full table scans
SELECT * FROM sys.statements_with_full_table_scans
ORDER BY exec_count DESC
LIMIT 20;

-- Find tables with no indexes
SELECT t.table_schema, t.table_name
FROM information_schema.tables t
LEFT JOIN information_schema.statistics s
  ON t.table_schema = s.table_schema
  AND t.table_name = s.table_name
WHERE t.table_type = 'BASE TABLE'
  AND s.index_name IS NULL
  AND t.table_schema NOT IN ('information_schema', 'mysql', 'performance_schema');
For a specific slow query, always use EXPLAIN:
EXPLAIN SELECT o.order_id, u.email, SUM(oi.quantity * oi.price) as total
FROM orders o
JOIN users u ON o.user_id = u.id
JOIN order_items oi ON o.order_id = oi.order_id
WHERE o.status = 'pending'
  AND o.created_at > '2026-01-01'
GROUP BY o.order_id;
Look for type: ALL (full scan) and rows values in the millions — these are your targets. Add composite indexes matching your WHERE and ORDER BY clauses:
-- Add composite index covering the WHERE clause
ALTER TABLE orders ADD INDEX idx_status_created (status, created_at);

-- Verify with EXPLAIN again
EXPLAIN SELECT ...
Step 6: Table Maintenance and Fragmentation
Over time, InnoDB tables accumulate page fragmentation from DELETE operations, degrading scan performance:
# Check fragmentation levels
mysql -e "SELECT TABLE_NAME,
  ROUND(DATA_FREE/1024/1024, 2) AS data_free_mb,
  ROUND(DATA_LENGTH/1024/1024, 2) AS data_mb
FROM information_schema.TABLES
WHERE TABLE_SCHEMA = 'your_database'
ORDER BY data_free_mb DESC;"

# Rebuild fragmented tables (online for InnoDB)
ALTER TABLE wp_postmeta ENGINE=InnoDB;
Automate weekly maintenance with a cron job:
# /etc/cron.weekly/mysql-optimize
#!/bin/bash
mysqlcheck --optimize --all-databases -u root -p"$MYSQL_ROOT_PASSWORD" 2>/dev/null
Step 7: Monitoring with Performance Schema
Enable Performance Schema for real-time bottleneck detection:
[mysqld]
performance_schema = ON
performance_schema_instrument = 'statement/%=ON'
performance_schema_consumer_events_statements_history_long = ON
Query the top resource-consuming statements:
SELECT digest_text, count_star,
  ROUND(avg_timer_wait/1000000000000, 4) AS avg_seconds,
  ROUND(sum_timer_wait/1000000000000, 4) AS total_seconds
FROM performance_schema.events_statements_summary_by_digest
ORDER BY sum_timer_wait DESC
LIMIT 10;
This complements the NGINX performance tuning and PHP-FPM configuration layers for a fully optimized LEMP stack on Pakistan VPS infrastructure.
Expected Performance Gains
After applying these configurations on a typical 4GB VPS running WordPress with WooCommerce:
| Metric | Before Tuning | After Tuning |
|---|---|---|
| Average query time | 450ms | 28ms |
| Slow queries/hour | 1,200+ | <15 |
| Max concurrent connections | 50 (errors) | 200 (stable) |
| InnoDB hit ratio | 78% | 99.2% |
| TTFB (WordPress homepage) | 820ms | 180ms |
Database tuning is foundational — no amount of CDN or caching can compensate for a database returning 500ms query results. On NVMe-backed Pakistan VPS hosting, a properly tuned MariaDB installation should sustain sub-30ms average query times for typical CMS workloads.
