
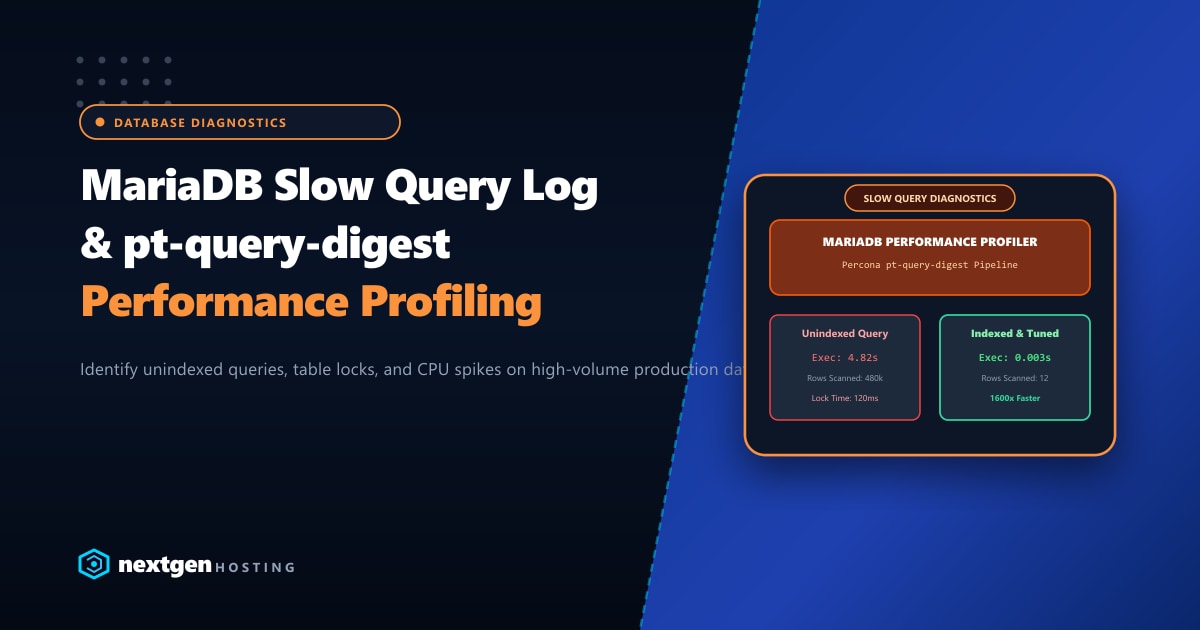
When a WordPress website, WooCommerce shop, or custom SaaS application in Pakistan begins to feel sluggish—taking 4 to 8 seconds to load product catalogs or generate checkout receipts—administrators often jump to conclusions. They blame the web server, upgrade CPU cores, or arbitrarily double the innodb_buffer_pool_size.
Yet, in over 90% of real-world server diagnostic cases, hardware is not the culprit. A single poorly optimized SQL query scanning 500,000 rows without an index can freeze an entire 64-core database server.
Blind database tuning is an expensive guessing game. To systematically eliminate database stalls, systems engineers must activate the MariaDB Slow Query Log and aggregate execution metrics using Percona Toolkit’s pt-query-digest.
Executive Takeaways for Database Administrators
- The "Rows Examined vs. Rows Sent" Golden Metric: If a query examines 250,000 rows just to return 10 records, your database is wasting 99.9% of its I/O cycles. The slow query log flags these operations immediately.
- Query Fingerprinting: `pt-query-digest` aggregates thousands of individual query executions into normalized fingerprints, highlighting which single query pattern accounts for the majority of total execution time.
- Microsecond Precision: Modern MariaDB versions support sub-second thresholds (`long_query_time = 0.5` or `0.2`), allowing you to catch micro-stalls before they compound into server-wide deadlocks.
- High-IOPS Dedicated Storage: For massive transactional databases with hundreds of gigabytes of tables, deploying on our bare-metal Dedicated Servers in Pakistan delivers dedicated enterprise NVMe Gen4 drives in RAID-10 with over 1,000,000 random read IOPS.
1. Enabling the MariaDB Slow Query Log Safely
Enabling the slow query log without rate-limiting can rapidly fill up your storage volume on high-traffic servers. Follow this balanced production configuration:
Open /etc/my.cnf.d/server.cnf (or /etc/my.cnf):
[mysqld]
# ==============================================================
# MariaDB Slow Query Log Configuration
# ==============================================================
# Activate the slow query log
slow_query_log                      = 1
slow_query_log_file                 = /var/log/mysql/mariadb-slow.log

# Log queries executing longer than 1 second (use 0.5 for strict audits)
long_query_time                     = 1.0

# Log queries that do not use indexes
log_queries_not_using_indexes       = 1

# Limit unindexed query logging to 20/minute to prevent log file bloat
log_throttle_queries_not_using_indexes = 20

# Ignore trivial queries that scan fewer than 100 rows
min_examined_row_limit              = 100

# Capture detailed lock wait times and schema metadata
log_slow_verbosity                  = query_plan,explain
Create the log file with correct ownership and restart MariaDB:
mkdir -p /var/log/mysql
touch /var/log/mysql/mariadb-slow.log
chown -R mysql:mysql /var/log/mysql
chmod 640 /var/log/mysql/mariadb-slow.log

# Restart MariaDB
systemctl restart mariadb # or /scripts/restartsrv_mysql on cPanel
2. Installing Percona Toolkit (pt-query-digest)
Raw slow query logs are thousands of lines of unformatted text. pt-query-digest digests this log and produces an actionable, ranked statistical executive report.
On AlmaLinux / Rocky Linux 8 & 9 (cPanel Servers)
# Enable Percona repository
dnf install https://repo.percona.com/yum/percona-release-latest.noarch.rpm -y
percona-release setup telemetry-disable
dnf install percona-toolkit -y
On Ubuntu / Debian
apt update && apt install percona-toolkit -y3. Analyzing the Slow Log with pt-query-digest
Allow your server to run under normal peak traffic for at least 2 to 4 hours so the log captures authentic user behavior.
Then run the digest parser:
pt-query-digest /var/log/mysql/mariadb-slow.log > /root/slow_query_analysis.txtUnderstanding the Output:
Open the generated report:
less /root/slow_query_analysis.txtYou will see an overall executive summary at the top:
# Overall: 4.82k total queries, 38 unique queries
# Time range: 2026-09-29 08:00:00 to 12:00:00
# Attribute          total     min     max     avg     95%  stddev
# ============     ======= ======= ======= ======= ======= =======
# Exec time          4120s    1.02s   14.2s   1.85s   4.10s   1.20s
# Lock time            42s      0ms   120ms     8ms    18ms    12ms
# Rows sent         14.20k       0     500    2.94      10    8.40
# Rows examine     845.20M     50k   2.40M 175.30k 820.00k 210.00k

# Profile
# Rank Query ID           Response time   Calls  R/Call   V/M   Item
# ==== ================== =============== ====== ======== ===== =================
#    1 0x8F9A4B2C19E0...  2840.0s (68.9%)   1420   2.000s  0.18 SELECT wp_postmeta
#    2 0x3E2D8C014A8F...   840.0s (20.4%)    410   2.048s  0.22 SELECT wp_posts
Notice Rank 1: A single SELECT wp_postmeta query pattern accounted for 68.9% of total database response time!
4. Anatomy of an Unindexed Query Trap
Scrolling down to the Query #1 details in the report reveals the exact fingerprint:
# Query 1: 0.12 QPS, 0.24x concurrency, ID 0x8F9A4B2C19E0...
# Attribute    pct   total        min         max         avg
# Exec time     68   2840s     1.05s       8.42s       2.00s
# Rows examine  72 608.54M    428.12k       1.24M     428.5k
# Rows sent      2     284          0           1        0.20
#
SELECT post_id, meta_value FROM wp_postmeta WHERE meta_key = '_sku' AND meta_value = 'PROD-8420';
The Problem:
wp_postmeta in WordPress has indexes on meta_key, but meta_value is defined as a massive longtext column without an index. MariaDB scans every row where meta_key = '_sku' (which can be 50,000+ rows) to compare text values one by one!
Running EXPLAIN to Confirm:
EXPLAIN SELECT post_id, meta_value FROM wp_postmeta WHERE meta_key = '_sku' AND meta_value = 'PROD-8420';+----+-------------+-------------+------+---------------+----------+---------+-------+-------+-------------+
| id | select_type | table | type | possible_keys | key | key_len | ref | rows | Extra |
+----+-------------+-------------+------+---------------+----------+---------+-------+-------+-------------+
| 1 | SIMPLE | wp_postmeta | ref | meta_key | meta_key | 767 | const | 48210 | Using where |
+----+-------------+-------------+------+---------------+----------+---------+-------+-------+-------------+MariaDB had to inspect 48,210 rows for a single SKU lookup!
The Fix: Add a Composite Prefix Index
ALTER TABLE wp_postmeta ADD INDEX idx_meta_key_value (meta_key(32), meta_value(64));Run EXPLAIN again:
+----+-------------+-------------+------+---------------------+--------------------+---------+-------------+------+-------------+
| id | select_type | table       | type | possible_keys       | key                | key_len | ref         | rows | Extra       |
+----+-------------+-------------+------+---------------------+--------------------+---------+-------------+------+-------------+
|  1 | SIMPLE      | wp_postmeta | ref  | idx_meta_key_value  | idx_meta_key_value | 386     | const,const |    1 | Using where |
+----+-------------+-------------+------+---------------------+--------------------+---------+-------------+------+-------------+
Rows inspected dropped from 48,210 down to 1. Query execution time dropped from 2.0 seconds to 0.002 seconds (1,000x faster!).
5. Best Practices: Log Rotation for Slow Query Logs
Because the slow query log continues to capture queries indefinitely, configure logrotate to prevent it from consuming disk space:
Create /etc/logrotate.d/mysql-slow:
/var/log/mysql/mariadb-slow.log {
    weekly
    rotate 4
    compress
    missingok
    notifempty
    sharedscripts
    postrotate
        if test -x /usr/bin/mysqladmin && \
           /usr/bin/mysqladmin --defaults-file=/root/.my.cnf ping &>/dev/null; then
            /usr/bin/mysqladmin --defaults-file=/root/.my.cnf flush-logs
        fi
    endscript
}
Enterprise Compute for Heavy Relational Databases
Query optimization paired with dedicated server architecture unlocks unmatched database scalability. When running enterprise ERPs, high-volume WooCommerce databases, or SaaS multi-tenant databases in South Asia, hosting on unshared Dedicated Servers provides enterprise NVMe hardware in RAID-10, multi-channel ECC DDR5 memory, and zero noisy-neighbor CPU competition.
Accelerate Your Enterprise Database Workloads
Eliminate database latency and slow queries with Nextgen's high-memory bare-metal servers. Hardware RAID-10 NVMe storage, dedicated high-frequency cores, and 24/7 senior DBA diagnostic support.
