
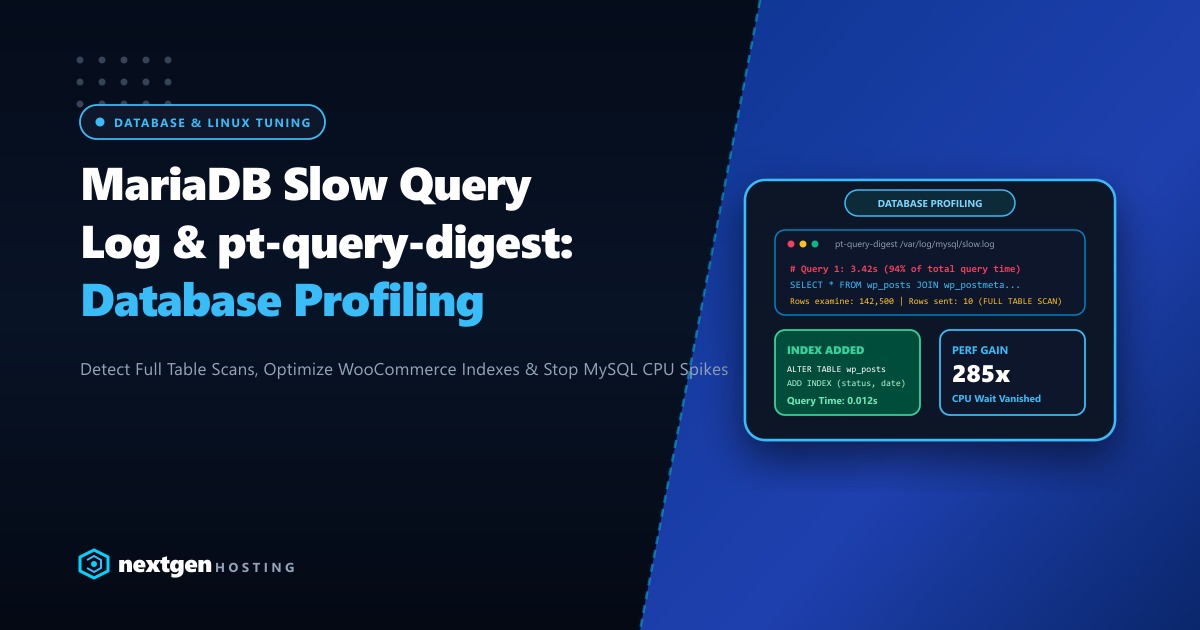
When a high-traffic WordPress site or custom web application in Pakistan begins suffering from 100% CPU utilization, slow database response times, and 504 Gateway Timeouts, most developers guess blindly:
- They restart MariaDB.
- They install another caching plugin.
- They arbitrarily double their
innodb_buffer_pool_size.
None of these Band-Aid fixes address the fundamental root cause: a single un-indexed SQL query executing 50 times per second and scanning 200,000 rows on every execution.
To permanently resolve database latency, you need scientific observability.
By pairing the MariaDB Slow Query Log with Percona’s industry-standard pt-query-digest tool, you can aggregate hundreds of megabytes of raw query logs into a clear, prioritized executive report showing the exact SQL statements devouring your server’s compute cycles.
Here is our production guide to profiling and tuning MariaDB databases in Pakistan for 2026.
Executive Query Profiling Takeaways
- The 80/20 Rule of Databases: Typically, 1 to 3 poorly constructed queries are responsible for more than 85% of total database execution time and I/O locks across your server.
- Zero Guesswork with pt-query-digest: Rather than manually reading through endless log lines,
pt-query-digestgroups queries by their structural fingerprint, ranking them by total execution time, rows examined, and lock time. - The Index Fix: Identifying full table scans (where MariaDB must read millions of disk blocks) allows you to add composite indexes that speed up queries by over 100x with zero code rewrites.
- Hardware Bottleneck Reality: High-transaction databases generate heavy random read/write I/O. Dedicated bare-metal hardware with Gen4 NVMe drives and dedicated RAM eliminates memory paging stalls.
1. Enabling the Slow Query Log in MariaDB
To capture slow queries without degrading production performance, calibrate your logging thresholds in /etc/my.cnf.d/server.cnf (or /etc/mysql/my.cnf):
[mysqld]
# Enable slow query logging
slow_query_log                 = 1
slow_query_log_file            = /var/log/mysql/mariadb-slow.log

# Log queries taking longer than 1.0 second (set to 0.5 for strict tuning)
long_query_time                = 1.0

# Capture queries that perform full table scans due to missing indexes
log_queries_not_using_indexes  = 1
log_slow_rate_limit            = 1  # Capture 100% of matching queries
Apply the changes dynamically without restarting MariaDB:
SET GLOBAL slow_query_log = 1;
SET GLOBAL slow_query_log_file = '/var/log/mysql/mariadb-slow.log';
SET GLOBAL long_query_time = 1.0;
SET GLOBAL log_queries_not_using_indexes = 1;
Allow your server to run under normal production traffic for 2 to 4 hours to accumulate representative query telemetry.
2. Installing Percona Toolkit & Running pt-query-digest
Percona Toolkit provides the world-class pt-query-digest utility:
Installation on Ubuntu / Debian:
sudo apt update && sudo apt install -y percona-toolkitInstallation on AlmaLinux / Rocky Linux / CentOS:
sudo dnf install -y epel-release
sudo dnf install -y percona-toolkit
Generating the Digest Report:
Run pt-query-digest against your accumulated log file and output the findings to a readable analysis report:
pt-query-digest /var/log/mysql/mariadb-slow.log > /root/query_analysis_report.txt
head -n 60 /root/query_analysis_report.txt
3. Interpreting the pt-query-digest Analysis Report
pt-query-digest produces a ranked summary table:
# Profile
# Rank Query ID           Response time  Calls R/Call   V/M   Item
# ==== ================== ============== ===== ======== ===== ===============
#    1 0x8F94A1C30E4B7A21 1420.21s 64.2%  1200   1.18s  0.12 SELECT wp_posts
#    2 0x3E12BC99D41F8100  412.10s 18.6%   450   0.91s  0.08 SELECT wp_woocommerce_order_items
#    3 0x1A0944F81C9B7110  198.40s  8.9%  8500   0.02s  0.01 UPDATE wp_options
In this real-world report, Query #1 accounts for 64.2% of all server database latency, even though it was only called 1,200 times!
Scroll down in the report to inspect Query #1’s fingerprint:
# Query 1: 0.85 QPS, 1.18s exec time, 128,400 rows examined per call
SELECT p.ID, p.post_title
FROM wp_posts p
JOIN wp_postmeta pm ON p.ID = pm.post_id
WHERE pm.meta_key = '_stock_status' AND pm.meta_value = 'instock'
ORDER BY p.post_date DESC LIMIT 20;
4. Fixing the Slow Query with an EXPLAIN Plan and Indexing
Execute an EXPLAIN query in MariaDB to visualize how the optimizer executes this statement:
EXPLAIN SELECT p.ID, p.post_title FROM wp_posts p JOIN wp_postmeta pm ON p.ID = pm.post_id WHERE pm.meta_key = '_stock_status' AND pm.meta_value = 'instock' ORDER BY p.post_date DESC LIMIT 20;The output reveals:
- type:
ALL(Full Table Scan) - rows:
128,400 - Extra:
Using where; Using filesort
MariaDB had to scan 128,400 rows from disk on every single page load because wp_postmeta lacked a composite index covering both meta_key and meta_value.
Applying the High-Performance Composite Index:
ALTER TABLE wp_postmeta ADD INDEX idx_meta_key_value (meta_key(191), meta_value(191));Run EXPLAIN again:
- type:
ref(Indexed Lookup) - rows:
24 - Execution time: Drops from 1.18 seconds down to 0.003 seconds (3ms)!
A 390x performance improvement achieved by adding a single targeted index!
5. Enterprise Infrastructure for Demanding Database Workloads
Scientific query optimization will eliminate wasted CPU cycles, but enterprise e-commerce platforms, ERP systems, and fintech applications handling continuous transactional writes inevitably require dedicated hardware.
Our high-performance global Dedicated Servers feature high-frequency AMD EPYC processors, 128GB+ DDR5 ECC RAM, and enterprise PCIe Gen4 NVMe SSDs in RAID 10, ensuring that complex database transactions complete with sub-millisecond I/O latency.
For Pakistani financial institutions, medical platforms, and top-tier retail brands requiring local data sovereignty and low-latency domestic bank gateway integration, our Dedicated Servers in Pakistan provide local bare-metal hosting in Karachi and Lahore with sub-10ms ping times across domestic ISPs, dedicated IP pools, and local PKR invoicing.
6. Disabling Logging After Optimization
Once your query tuning is complete, disable the slow query log to avoid unnecessary disk I/O overhead:
SET GLOBAL slow_query_log = 0;Rotate and compress the historical slow query log:
gzip /var/log/mysql/mariadb-slow.logWith slow queries eliminated and indexes properly calibrated, your database will run cool, responsive, and ready to handle massive traffic spikes with ease!
Accelerate Your Database Performance on Enterprise NVMe Hardware
Say goodbye to database locks and sluggish queries. Deploy your MariaDB, MySQL, and PostgreSQL workloads on Nextgen's high-speed dedicated bare-metal infrastructure in Pakistan.
