
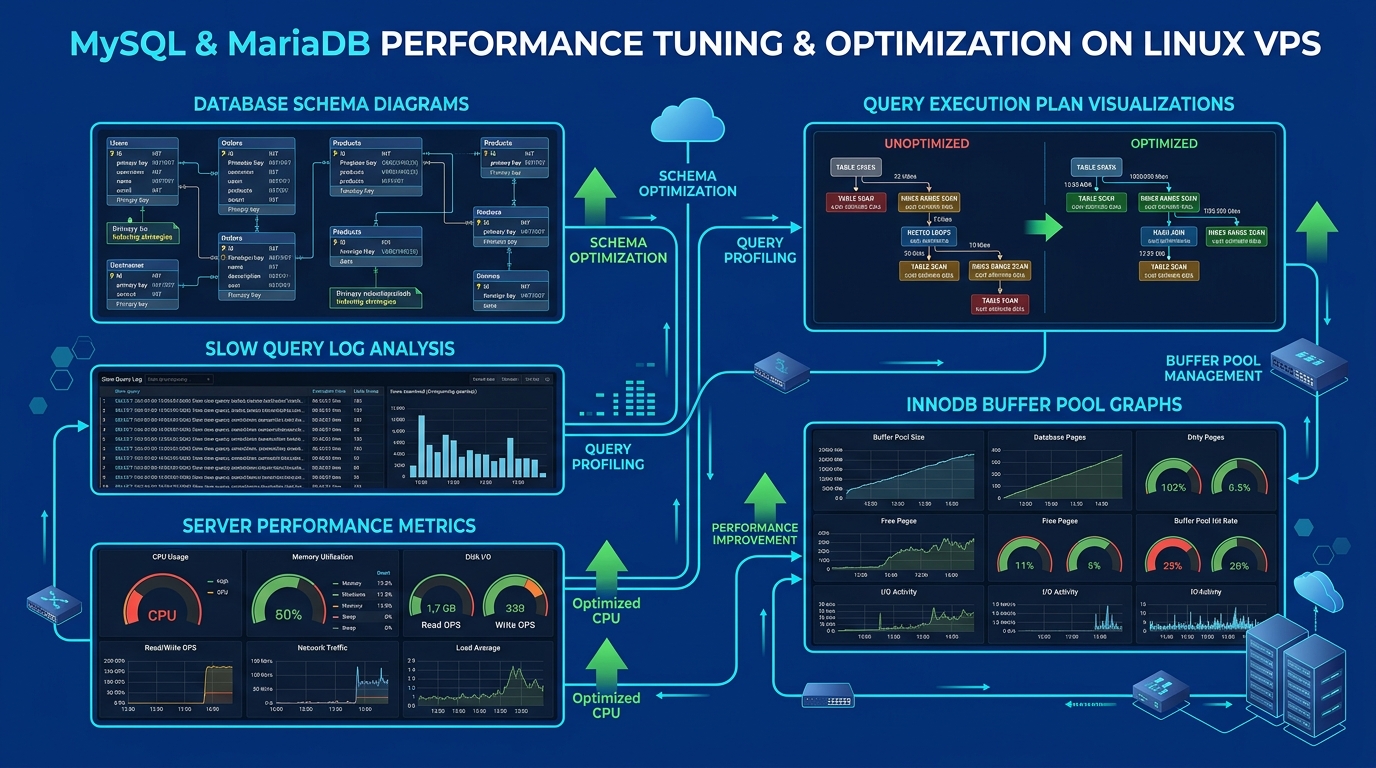
Troubleshooting database latency in a WordPress/MariaDB/cPanel environment requires a systematic approach, moving beyond surface-level caching plugins and diving deep into Linux resource constraints, InnoDB architecture, and complex MySQL queries.
When operating high-traffic WordPress deployments on a VPS or Dedicated server, generic advice often falls short. In this guide, we explore a deep-knowledge diagnostic workflow for identifying and resolving severe MariaDB latency.
For robust environments capable of handling optimized workloads, you might want to consider our specialized VPS hosting in Pakistan to ensure maximum IOPS and dedicated resources.
1. Isolating the Bottleneck: CPU, I/O, or Locking?
The first step in any Linux troubleshooting scenario is to determine whether the database latency is caused by CPU starvation, disk I/O bottlenecks, or internal table/row locking.
Step 1.1: Tracing System-Level I/O with iotop and iostat
A frequent cause of database latency is high I/O wait. When MariaDB’s InnoDB buffer pool is exhausted, the system reverts to aggressive disk swapping (thrashing).
# Check for CPU I/O wait percentages (wa)
top -c

# Analyze disk read/write per second on your block devices
iostat -dx 2 5

# Identify processes consuming the most I/O
iotop -oPa
If iostat reveals await times exceeding 10-20ms consistently on the storage device hosting /var/lib/mysql, your primary issue is storage latency or inadequate RAM allocation for the innodb_buffer_pool_size.
Step 1.2: Real-Time MySQL Process Analysis
Use mytop or mtop to inspect running queries in real-time. If you do not have it installed, you can leverage the native MySQL prompt:
SHOW FULL PROCESSLIST;Look for states like:
Copying to tmp table on disk: The query requires a temporary table larger thantmp_table_sizeormax_heap_table_size, forcing a slow disk write.Waiting for table level lock: Often indicative of MyISAM tables being used instead of InnoDB, or complexALTER TABLEoperations blocking reads.
2. Advanced Query Diagnostics
If the server has plenty of overhead but the application remains slow, the bottleneck lies within the queries themselves.
Step 2.1: Configuring the Slow Query Log for Microsecond Precision
The standard slow query log often misses rapid, repetitive queries that collectively degrade performance. Modify /etc/my.cnf (or /etc/my.cnf.d/server.cnf on cPanel/AlmaLinux environments):
slow_query_log = 1
slow_query_log_file = /var/log/mysql/slow-queries.log
long_query_time = 0.5  # Capture anything taking over 500ms
log_queries_not_using_indexes = 1
Restart MariaDB via systemd or cPanel’s service manager:
systemctl restart mariadbStep 2.2: Parsing Logs with pt-query-digest
Raw slow query logs are overwhelming. Install Percona Toolkit to aggregate the data:
pt-query-digest /var/log/mysql/slow-queries.log > /root/query-analysis.txtThis output will highlight the worst offenders. In WordPress, specifically WooCommerce, you will often find unindexed JOIN operations on wp_postmeta.
3. Remediating WordPress Schema Inefficiencies
WordPress’s EAV (Entity-Attribute-Value) schema for wp_postmeta is notoriously poorly optimized for scale.
The Autoloaded Options Trap
A massive wp_options table with excessive autoload='yes' rows forces MariaDB to load megabytes of redundant data into RAM on every single page load.
-- Identify autoload size (Anything over 1-2MB is a major red flag)
SELECT SUM(LENGTH(option_value)) as autoload_size
FROM wp_options
WHERE autoload='yes';
Resolution: Identify orphaned transients or large serialized arrays (often dumped by bad plugins) and set autoload='no' for items that are not needed globally.
4. Tuning InnoDB for Modern Workloads
Generic cPanel installations ship with conservative MySQL settings designed for 1GB RAM instances. If you are operating a 16GB or 32GB server, these defaults are actively harming your performance.
Essential my.cnf Adjustments
Run MySQLTuner after 24 hours of uptime to gather metrics, but pay special attention to these variables:
innodb_buffer_pool_size: Set this to 60-70% of total system RAM if the server is exclusively running databases, or 30-40% for a combined web/DB cPanel server.innodb_buffer_pool_instances: Set to 1 for every 1GB of buffer pool to reduce mutex contention.innodb_flush_log_at_trx_commit:1(Default): ACID compliant, safest, slowest.2: Flushes to OS cache every second. Massive performance boost with minimal risk (only lose 1 second of data on OS crash). Highly recommended for heavy WooCommerce sites.
join_buffer_size: Increase cautiously (e.g., 2M to 4M) to assist complex unindexed WordPress queries, but beware of memory exhaustion as this is allocated per connection.
Conclusion
Resolving database latency in WordPress is rarely solved by a single magic bullet. By meticulously tracing system I/O, utilizing microsecond-precision query logging, optimizing WordPress’s unique schema pitfalls, and tuning InnoDB parameters, you can achieve drastic performance gains. For mission-critical deployments, ensure your underlying infrastructure provides the IOPS necessary by exploring premium bare-metal or VPS servers.
Need Enterprise-Grade Performance?
If your workload demands maximum processing power and zero resource-sharing, explore our bare-metal Dedicated Servers and Dedicated Servers in Pakistan. We offer ultra-low latency, unmetered bandwidth, and enterprise-grade hardware to scale your operations seamlessly.
