
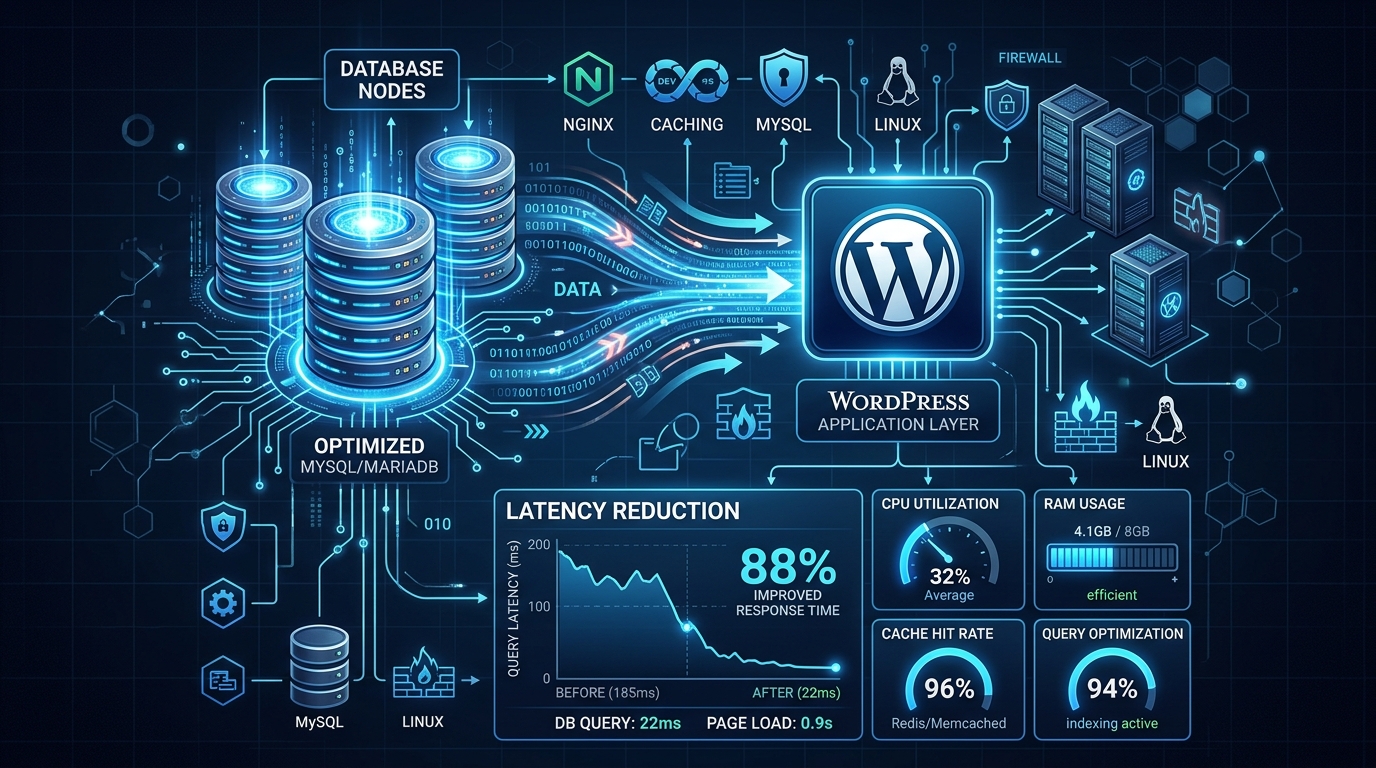
Troubleshooting complex database latency in a WordPress/cPanel environment requires a systematic approach to isolate whether the bottleneck is caused by application-level queries, database configuration, or server resource constraints. When your site feels sluggish, TTFB is high, but the server load seems deceptively normal, diving into the database layer is the natural next step.
This guide provides a comprehensive framework for diagnosing and fixing WordPress database latency issues on a cPanel-managed Linux server.
1. Immediate Application-Level Diagnosis
Before adjusting server settings or delving into kernel parameters, identify exactly which queries are causing the delay. A poorly coded plugin or an unoptimized theme is often the culprit.
Query Monitor Plugin
This is the most essential tool for WordPress troubleshooting. It identifies slow queries, duplicate queries, and resource-heavy plugins on a per-page basis. Look for:
- Queries taking longer than 0.1 seconds (100ms).
- Queries appearing in high volumes (e.g., repeating calls in a loop - the infamous N+1 problem).
Check Autoloaded Data
Use Query Monitor or phpMyAdmin to check the wp_options table. If the autoloaded data size exceeds 1MB, it can significantly slow down every page load, as WordPress loads all these options into memory on every request.
SELECT SUM(LENGTH(option_value)) as autoload_size FROM wp_options WHERE autoload='yes';If the result is large, you need to clean up orphaned options or move non-critical options to autoload='no'.
Database Bloat
Over time, databases accumulate transients, post revisions, and orphaned metadata. Use database optimization plugins to clean up this “junk” data, then perform an OPTIMIZE TABLE operation via phpMyAdmin to reclaim overhead and defragment the InnoDB tables.
2. Identifying Server-Level Bottlenecks
If the issue is not limited to specific plugins, investigate server performance via cPanel/WHM:
Resource Usage Limits (CloudLinux)
Check the “Resource Usage” or “Metrics” section in cPanel. If your site is hitting CPU, RAM, or I/O limits imposed by CloudLinux (LVE limits), database queries will be throttled, causing apparent latency.
Slow Query Log
- If you have root access (VPS/Dedicated): Enable the slow query log in WHM or by editing your
my.cnf(ormy.cnf.d/server.cnf) file:
This records every query exceeding your threshold (e.g., 1 second). You can then useslow_query_log = 1 slow_query_log_file = /var/log/mysql/slow-query.log long_query_time = 1mysqldumpslowto analyze this log and pinpoint the exact SQL statements responsible for the lag. - If you are on shared hosting: You likely cannot enable this yourself. Contact your hosting provider’s support team and ask them to provide a slow query report.
MySQL Process List
In phpMyAdmin, use the Status tab to view currently running queries. Alternatively, from SSH:
mysqladmin processlist -u root -pLook for queries in the Copying to tmp table, Sending data, or Locked states.
3. Server & Database Tuning
Once the cause is identified, you can apply optimizations:
Object Caching
Implement Redis or Memcached. This stores database results in memory, drastically reducing the number of direct hits to the MySQL/MariaDB database. This is often the most effective way to solve “mystery” latency. Many modern caching plugins support Redis integration.
Indexing
If the slow query log reveals queries searching through large tables (like wp_postmeta) without an index, use EXPLAIN in phpMyAdmin to see how the query is executed.
EXPLAIN SELECT * FROM wp_postmeta WHERE meta_key = '_some_custom_key';If the query scans all rows (type ALL), you might need to add indexes to the relevant columns.
Server Configuration (my.cnf)
If you have root access, tools like MySQLTuner (a Perl script) can analyze your database status variables and suggest adjustments based on your actual usage patterns. Key parameters often requiring tuning include:
innodb_buffer_pool_size: Should generally be set to 60-80% of total server RAM on a dedicated database server, or less if sharing with a web server.max_connections: Ensure this isn’t set too low (causing connection drops) or too high (causing memory exhaustion).
Consider Upgrading
If you’ve optimized your application and tuned your database, but latency persists due to sheer traffic volume, it might be time to move from shared hosting to a more robust solution like a dedicated VPS in Pakistan to guarantee resource availability and I/O performance.
Summary Checklist for Troubleshooting
| Step | Action | Tool / Method |
|---|---|---|
| 1 | Identify slow queries/plugins | Query Monitor (WP Plugin) |
| 2 | Check for resource throttling | cPanel -> Resource Usage (LVE) |
| 3 | Clean up bloat/optimize tables | phpMyAdmin / WP-Optimize |
| 4 | Enable object caching | Redis/Memcached integration |
| 5 | Analyze deep performance | Slow Query Log / MySQLTuner |
Troubleshooting complex database latency is iterative. By systematically ruling out application-level issues before adjusting server configurations, you can achieve a stable, fast WordPress site.
Need Enterprise-Grade Performance?
If your workload demands maximum processing power and zero resource-sharing, explore our bare-metal Dedicated Servers and Dedicated Servers in Pakistan. We offer ultra-low latency, unmetered bandwidth, and enterprise-grade hardware to scale your operations seamlessly.
