
Deploying rate limiting on enterprise web portals, mobile application gateways, and transactional APIs is crucial for deflecting credential stuffing, bot scraping, and Denial of Service (DoS) floods. However, setting rate limiting thresholds in production is notoriously treacherous.
If you configure limit_req too aggressively, you inadvertently block legitimate users, enterprise offices sharing a single public IP via NAT, and high-velocity mobile app sessions with 429 Too Many Requests or 503 Service Unavailable errors. Conversely, if you set it too permissively, scrapers and brute-force bots slip through undetected.
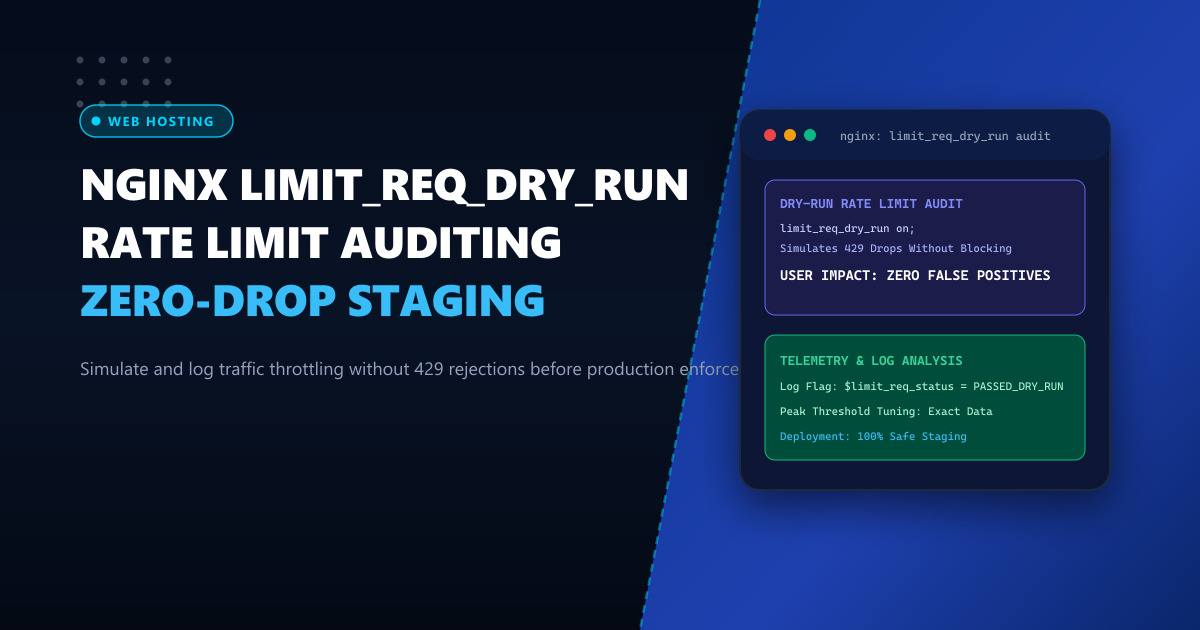
Historically, testing rate limiting required guessing thresholds or risking customer disruptions. Starting in Nginx 1.17.1+, Nginx introduced the limit_req_dry_run directive. This allows systems administrators to simulate rate limiting enforcement: requests that exceed thresholds are tracked, accounted for, and logged, but never delayed or rejected.
In this guide, we demonstrate how to configure limit_req_dry_run, log simulation flags into ELK / Prometheus, and calibrate production rate limits with mathematical precision.
Understanding limit_req_dry_run Mechanics
[ Inbound HTTP Request ]
            │
            ▼
   [ Nginx Rate Limiting Engine: limit_req_zone ]
            │
            ├─── Under Threshold? ───▶ Standard Processing (200 OK)
            │
            └─── Exceeds Threshold / Burst?
                       │
                       ▼
          [ Is limit_req_dry_run ON? ]
           ├─── YES ───▶ Logs "$limit_req_status = PASSED_DRY_RUN"
           │             Forwards request to Backend (NO 429 DROP!)
           │
           └─── NO ────▶ Enforces Immediate Rejection (429 Too Many Requests)
In dry-run mode:
- Nginx decrements and tracks the leaky bucket algorithm in shared memory exactly as it would in production.
- If a request violates the rate or burst limits, Nginx assigns the internal variable
$limit_req_statustoPASSED_DRY_RUN. - The request is passed upstream transparently to the backend application, ensuring zero user-facing impact.
- Telemetry logs allow you to analyze false-positive rates across corporate offices, ISP subnets, and automated client APIs.
Deploying API gateways on high-capacity Dedicated Servers provides the dedicated memory and network bandwidth to analyze thousands of concurrent dry-run sessions without degradation.
Step 1: Configuring limit_req_dry_run in Nginx
Open /etc/nginx/nginx.conf or your site configuration:
http {
    # Define a shared memory zone for tracking client IP addresses
    # 10m zone stores ~160,000 active IP states
    limit_req_zone $binary_remote_addr zone=api_audit_zone:10m rate=15r/s;

    # Custom log format exposing rate limiting variables
    log_format rate_audit '$remote_addr - $remote_user [$time_local] '
                          '"$request" $status $body_bytes_sent '
                          '"$http_user_agent" '
                          'rate_status: $limit_req_status';

    server {
        listen 443 ssl http2;
        server_name api.enterprise.com.pk;

        ssl_certificate /etc/ssl/certs/api.crt;
        ssl_certificate_key /etc/ssl/certs/api.key;

        access_log /var/log/nginx/api_rate_audit.log rate_audit;

        location /api/v1/ {
            # Apply rate limiting zone with burst tolerance
            limit_req zone=api_audit_zone burst=30 nodelay;

            # CRITICAL: Enable dry-run mode
            # Simulated throttling without rejecting legitimate clients!
            limit_req_dry_run on;

            # Set custom response code if dry-run were off
            limit_req_status 429;

            proxy_pass http://internal_api_pool;
            proxy_set_header Host $host;
            proxy_set_header X-Real-IP $remote_addr;
        }
    }
}
Reload Nginx:
nginx -t && systemctl reload nginxStep 2: Analyzing Dry-Run Simulation Logs
To inspect requests that would have been blocked under current thresholds:
# Filter access log for simulated throttles
grep "rate_status: PASSED_DRY_RUN" /var/log/nginx/api_rate_audit.log | head -n 10
Sample output:
111.119.160.42 - - [01/Oct/2026:13:02:18 +0500] "POST /api/v1/checkout HTTP/2.0" 200 482 "MobileApp/3.2" rate_status: PASSED_DRY_RUN
202.163.96.15 - - [01/Oct/2026:13:02:19 +0500] "GET /api/v1/products HTTP/2.0" 200 1204 "Mozilla/5.0..." rate_status: PASSED_DRY_RUN
Notice that the HTTP status returned to the client was 200 OK, while the rate_status accurately captured that the request breached the burst threshold.
To aggregate simulated rejections by IP address:
awk '/rate_status: PASSED_DRY_RUN/ {print $1}' /var/log/nginx/api_rate_audit.log | sort | uniq -c | sort -nr | head -n 10Step 3: Transitioning to Production Enforcement Safely
Once you have gathered 48 to 72 hours of telemetry and confirmed that legitimate enterprise IP pools (such as regional banking branches) are not triggering false positives:
location /api/v1/ {
    limit_req zone=api_audit_zone burst=30 nodelay;

    # Disable dry-run mode to activate real enforcement
    limit_req_dry_run off;

    proxy_pass http://internal_api_pool;
}
Reload Nginx:
nginx -s reloadOperational Comparison: Blind Deployment vs. Dry-Run Staging
| Dimension | Blind Rate Limiting | Staged with limit_req_dry_run |
|---|---|---|
| False-Positive Customer Outages | High (Immediate 429 errors) | Zero (0) Disrupted Users |
| Threshold Calibration Accuracy | Guesswork | Empirical Data from Production Traffic |
| NAT IP Aggregation Visibility | Discovered after customer complaints | Identified Pre-Enforcement in Logs |
| Rollback Risk | High | Zero Rollback Risk |
Hosting your high-concurrency API gateways and reverse proxies on dedicated Dedicated Servers in Pakistan ensures that security protections are verified with real telemetry before live enforcement.
Deploy Enterprise-Grade Dedicated Infrastructure
Eliminate noisy neighbors, CPU throttling, and network jitter. Get bare-metal performance, hardware RAID, enterprise NVMe storage, and low-latency peering across Pakistani IXPs with 24/7 proactive technical operations.
Explore Dedicated Servers in Pakistan