
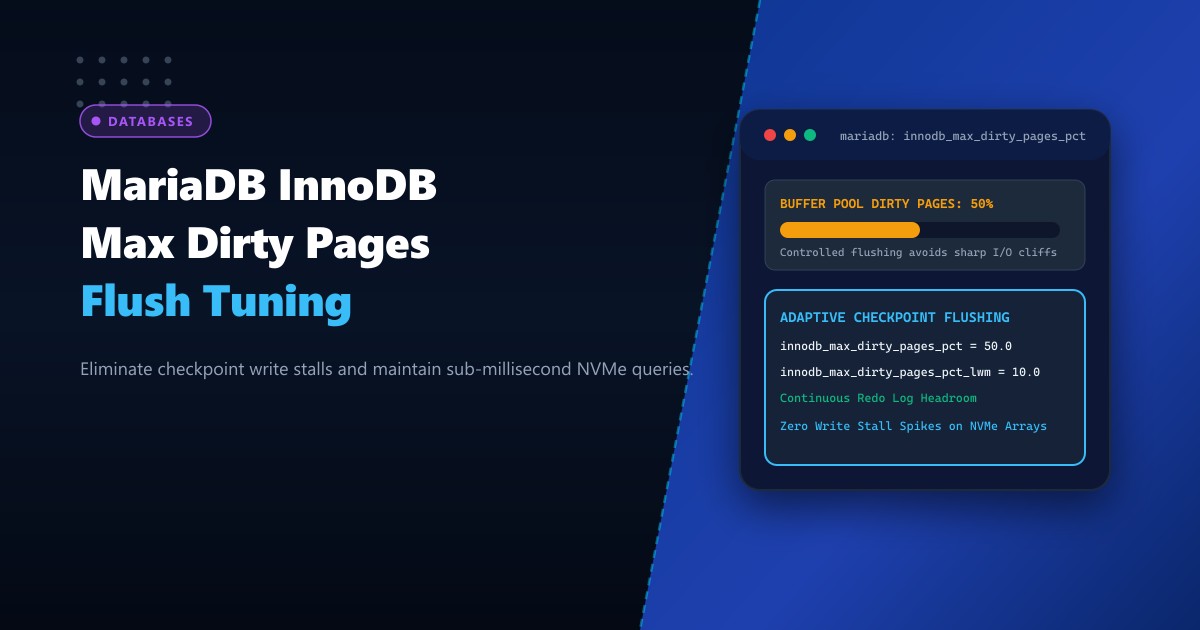
In heavy write-intensive database applications across Pakistan—such as core banking ledger recording, e-commerce order processing during nationwide sales events, logistics parcel tracking, and ERP accounting systems—MariaDB writes data changes into the memory-resident InnoDB Buffer Pool first as “dirty pages” before lazily flushing them to NVMe disk storage.
Under default MariaDB configurations, innodb_max_dirty_pages_pct is set to 75.0% or 90.0%. When a sudden surge of write transactions occurs, the percentage of dirty pages in the buffer pool quickly escalates. If the redo log fills up or dirty pages hit the emergency upper threshold, InnoDB abruptly halts new write queries to invoke synchronous furious flushing (checkpoint write stalls).
During a write stall, query latencies spike catastrophically from 2ms to over 5,000ms, web application threads freeze, and database connection pools become exhausted.
By deploying on enterprise Dedicated Servers equipped with high-IOPS NVMe arrays and properly tuning innodb_max_dirty_pages_pct, innodb_max_dirty_pages_pct_lwm, and InnoDB Adaptive Flushing, database architects can eliminate write stalls and ensure perfectly flat, predictable transaction response times.
How InnoDB Flush Curves Cause Checkpoint Write Stalls
The following diagram illustrates the latency difference between default threshold flushing and smooth adaptive flushing:
+-----------------------------------------------------------------------------------+
|               DEFAULT FLUSH SPIKES vs. ADAPTIVE FLUSH TUNING                      |
+-----------------------------------------------------------------------------------+
| 1. Default Behavior (High Threshold = Violent I/O Cliffs):                        |
|    - `innodb_max_dirty_pages_pct = 75%`                                           |
|    - Buffer pool accumulates massive backlog of dirty pages.                     |
|    - Redo log approaches capacity limit (Sync Checkpoint reached!).               |
|    - EMERGENCY FLUSHING TRIGGERS: InnoDB freezes SQL writes and furiously flushes |
|      tens of thousands of pages to disk!                                          |
|    - Result: Disk I/O saturates, query latency spikes 200x, app timeouts cascade! |
|                                                                                   |
| 2. Tuned Continuous Adaptive Flushing (Consistent Line Rate):                     |
|    - `innodb_max_dirty_pages_pct = 50.0%`                                         |
|    - `innodb_max_dirty_pages_pct_lwm = 10.0%` (Low Water Mark initiates flushing)|
|    - `innodb_adaptive_flushing = ON` (Algorithm monitors redo log velocity).     |
|    - Page cleaners flush dirty pages smoothly and continuously at steady rate.    |
|    - Redo log maintains plenty of headroom; emergency sync checkpoints NEVER hit! |
|    - Result: Steady sub-millisecond query execution even during peak order influx!|
+-----------------------------------------------------------------------------------+
Step 1: Inspecting Dirty Page Percentage & Checkpoint Age in MariaDB
Check your current buffer pool dirty page ratio and flush configuration:
SHOW GLOBAL VARIABLES LIKE 'innodb_max_dirty_pages_pct%';
SHOW GLOBAL VARIABLES LIKE 'innodb_adaptive_flushing%';
SHOW GLOBAL STATUS LIKE 'Innodb_buffer_pool_pages_dirty';
SHOW GLOBAL STATUS LIKE 'Innodb_buffer_pool_pages_total';
Calculate the active dirty page percentage in real time:
SELECT
  ROUND((VARIABLE_VALUE / (SELECT VARIABLE_VALUE FROM information_schema.GLOBAL_STATUS WHERE VARIABLE_NAME = 'Innodb_buffer_pool_pages_total')) * 100, 2) AS dirty_page_pct
FROM information_schema.GLOBAL_STATUS
WHERE VARIABLE_NAME = 'Innodb_buffer_pool_pages_dirty';
Inspect checkpoint lag and redo log headroom via SHOW ENGINE INNODB STATUS:
SHOW ENGINE INNODB STATUS\GLook for the LOG section:
Log sequence number          184920381029
Log flushed up to            184920381029
Pages flushed up to          184715029381
Last checkpoint at           184698102940
Subtract Last checkpoint at from Log sequence number. If the difference approaches the total capacity of your redo logs (innodb_log_file_size * innodb_log_files_in_group), your server is dangerously close to a synchronous write stall!
Step 2: Optimizing Dirty Page Thresholds and Adaptive Flushing for NVMe
For modern enterprise bare-metal servers equipped with PCIe Gen4/Gen5 NVMe storage, configure MariaDB to start flushing early and continuously.
Edit /etc/my.cnf.d/server.cnf:
[mysqld]
# 1. Lower target dirty page percentage
# Keeping dirty pages around 50% ensures substantial headroom during write bursts
innodb_max_dirty_pages_pct = 50.0

# 2. Configure Low Water Mark (LWM)
# MariaDB begins pre-emptive background flushing as soon as dirty pages hit 10%
innodb_max_dirty_pages_pct_lwm = 10.0

# 3. Enable Adaptive Flushing
# Continuously recalculates the required flush rate based on redo log generation speed
innodb_adaptive_flushing = ON
innodb_adaptive_flushing_lwm = 10.0

# 4. Tune I/O capacity to unleash high-speed NVMe storage
# Default values (200 / 400) throttle modern NVMe drives capable of 500k+ IOPS!
innodb_io_capacity = 15000
innodb_io_capacity_max = 30000

# 5. Enable multiple page cleaner threads (matches buffer pool instances)
# For a 64GB Buffer Pool with 8 instances:
innodb_buffer_pool_instances = 8
innodb_page_cleaners = 8

# 6. Expand Redo Log capacity to cushion prolonged write surges
# 2 x 4GB redo logs provide 8GB of write buffer headroom
innodb_log_file_size = 4G
innodb_log_files_in_group = 2
innodb_log_buffer_size = 64M

# 7. Disable Neighbor Flushing on solid-state drives
# Zero benefit on NVMe; disabling it eliminates unnecessary write amplification
innodb_flush_neighbors = 0
Apply dynamic settings without restarting (for runtime parameters):
SET GLOBAL innodb_max_dirty_pages_pct = 50.0;
SET GLOBAL innodb_max_dirty_pages_pct_lwm = 10.0;
SET GLOBAL innodb_io_capacity = 15000;
SET GLOBAL innodb_io_capacity_max = 30000;
SET GLOBAL innodb_flush_neighbors = 0;
Step 3: Monitoring Flush Velocity & Disk I/O with vmstat & iostat
Validate that MariaDB page cleaners are flushing smoothly without choking disk controllers:
# Monitor disk write activity and I/O wait on NVMe device every 2 seconds
iostat -xz 2 nvme0n1
Observe write statistics:
Device:   r/s    w/s    rkB/s     wkB/s    await  r_await  w_await  %util
nvme0n1   42.0  3850.0  672.0   124500.0   0.14    0.20     0.13    18.5%
Notice:
w/sremains steady at ~3,800 writes per second rather than spiking violently to 40,000 w/s and then dropping to zero.awaitlatency remains under0.15ms(sub-millisecond write performance).%utilremains below 25%, leaving immense I/O bandwidth for incoming client read queries!
Step 4: Tracking Redo Log Flush Health Over Time
Execute a lightweight SQL query to monitor page cleaner performance:
SELECT
  NAME,
  COUNT
FROM information_schema.INNODB_METRICS
WHERE NAME IN (
  'buffer_flush_adaptive_pages',
  'buffer_flush_background_pages',
  'buffer_flush_sync_pages'
);buffer_flush_adaptive_pages: Should increase continuously, showing smooth algorithmic flushing.buffer_flush_sync_pages: Must remain at ZERO (0). A count of zero proves that your database has completely avoided emergency synchronous checkpoint freezes!
Enterprise Database Hosting on High-IOPS Pakistani Infrastructure
Sustaining continuous background database flushing while executing hundreds of concurrent transaction commits requires uncompromising disk I/O performance and direct NVMe controller access. Multi-tenant public clouds enforce artificial IOPS burst caps and volume throttling that choke MariaDB page cleaners, triggering crippling write freezes.
Deploying on bare-metal Dedicated Servers in Pakistan guarantees dedicated PCIe Gen4/Gen5 NVMe storage arrays with millions of sustained IOPS, unthrottled write endurance, and unshared memory buses for massive InnoDB buffer pools.
Accelerate Enterprise Databases with NextGen Dedicated Servers
Eliminate checkpoint write stalls, achieve sub-millisecond database response times, and scale transaction processing seamlessly across Pakistan. NextGen dedicated hosting provides pure bare-metal compute, enterprise hardware RAID, and 24/7 technical administration.
Deploy Dedicated Servers in Pakistan